

Individual Assessments
Assess any individual and turn results into clear next steps
Create self-assessments, assessor-led reviews, evidence-based submissions and reassessments over time, then deliver personalised feedback via polished reports and interactive results.
"We immediately fell in love with the platform. We now have our own coaching platform that completely differentiates us from the competition."
Tim Hagen, Leader at Progress Coaching
"Our auditors automatically receive the reports so that they can review them. This has allowed us to scale, grow, and utilize the automation within the tool. It also frees up our auditors' time to focus more closely on the assessments."
Rob Van Buskirk, Co-founder at VanRein Compliance
"We looked into a number of different solutions and we found that they were often too rigid for our needs, overly complicated to set up and manage, and outside of our budget. Brilliant Assessments delivered everything we needed.
Debbie Ogier, Administrator for Best Bar None by Six Till Six
Brilliant uses for individual assessments
Whether you’re making a decision, planning development, reviewing evidence, or measuring progress, Brilliant Assessments helps you consistently assess one person and turn inputs into feedback you can use and share.
Common building blocks across these use cases
Conditional question paths to tailor the assessment experience
Scoring, rating levels, and benchmarks to make results easy to interpret
Professional outputs via downloadable reports and interactive results
Automated invitations and reminders to improve completion rates
Reassessment over time to track progress and impact
Evidence-based inputs (open text + document uploads) with optional AI-assisted interpretation
Branding and monetization options when the assessment is a paid deliverable
-
Use Brilliant Assessments as a structured diagnostic to speed up discovery, make your recommendations more defensible, and produce a polished deliverable you can share with the client.
Branded, client-facing experience and outputs
Scoring models that map to your methodology or framework
Report sections that translate results into recommendations
Optional evidence + AI-assisted interpretation to deepen insights
-
Use Brilliant Assessments to assess against a standard (knowledge checks, practical judgement, evidence requirements), and deliver a formal result that’s easy to understand and store.
Pass/fail or level-based outcomes via thresholds and bands
Evidence collection for standards-based assessment
Certificate-style or formal report outputs (where relevant)
Consistent structure across assessors, candidates, and intakes
-
When assessment needs to be grounded in real material, Brilliant Assessments can collect narrative responses and documents, then help transform that into structured scoring and clear feedback.
Uploads + open-text inputs for richer context
AI-assisted interpretation to draft feedback and summaries (with human review)
Clear linkage from evidence → criteria → result
Professional outputs that save reviewer time and improve consistency
-
Turn a performance conversation into something more consistent and actionable by assessing strengths, gaps, confidence, and behaviours against a framework — and generating a plan people can actually follow.
Competency-aligned scoring and rating definitions
Tailored development actions based on score ranges
A shareable report to anchor 1:1s, reviews, and planning
Reassessment later to track change and follow-through
-
Assess before and after training to measure what changed — knowledge, confidence, behaviour intent, or applied judgement — and produce an individual “impact story” rather than a vague completion tick.
Pre/post assessments using the same scoring model
Iteration comparisons to show movement over time
Role- or cohort-independent benchmarks (e.g., expected level)
Auto-generated feedback that highlights growth areas and next steps
-
If your assessment is a product — e.g., a leadership diagnostic, readiness check, or personalised report — Brilliant Assessments can support a premium, scalable experience.
Payment and access flow (e.g., via Stripe integration)
Automated delivery of results and reports
Tiered outputs (snapshot vs full report) if you want packages
Branding for a cohesive “product” experience
-
When you need a repeatable way to confirm understanding, gather attestations, or capture evidence, Brilliant Assessments can provide a consistent format and output — without manual chasing and write-ups.
Attestations + knowledge checks in one flow
Evidence prompts where proof is required
Automated invitations and reminders
Clear outcome summaries for stakeholders (report + results page)
Features you’ll love
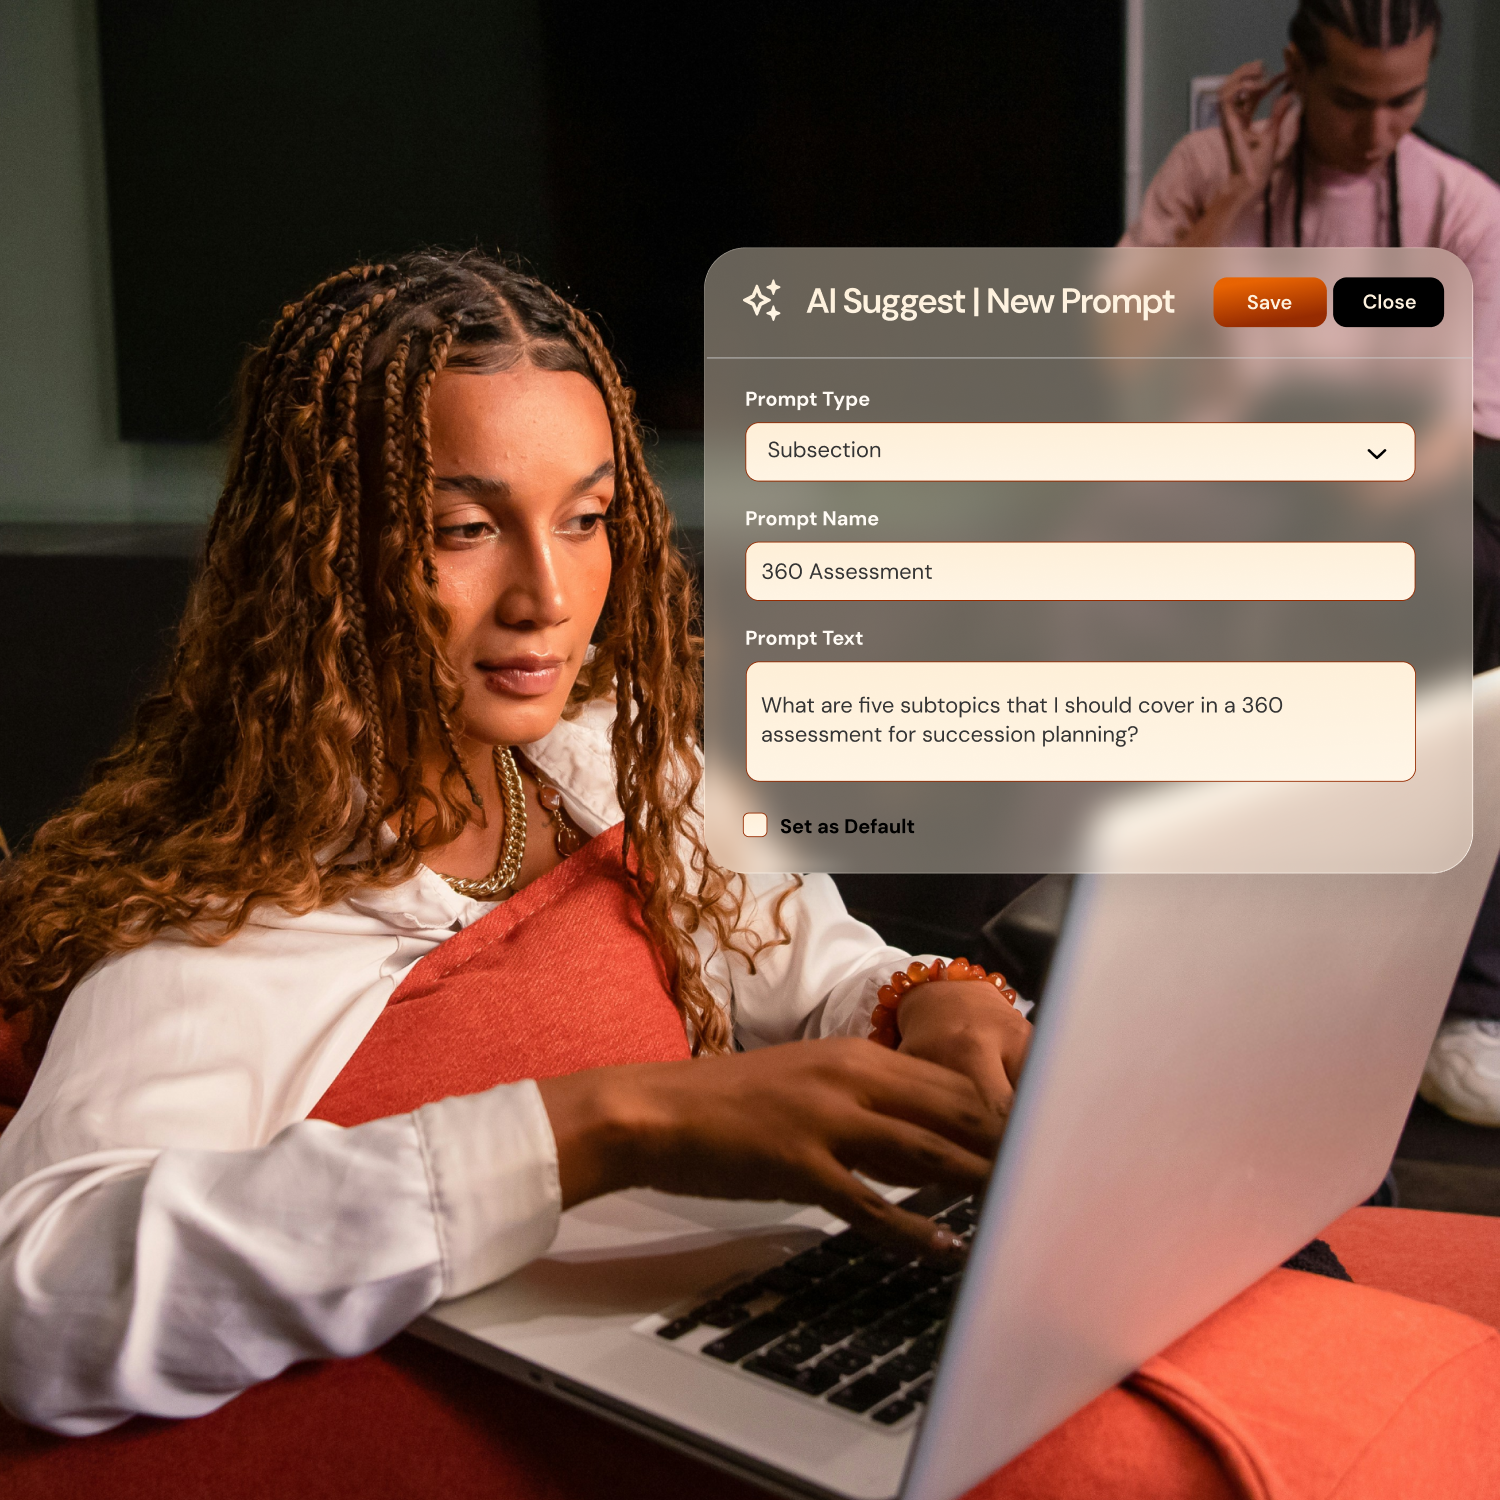
Build fast
Get a strong first draft in minutes, then keep, edit, or regenerate as needed.
Use AI Suggest to build out sections, subsections, questions and write your report text.
Match the assessment experience to your brand with logos, colours, and messaging.
Base follow‑up questions on previous answers with conditional logic.
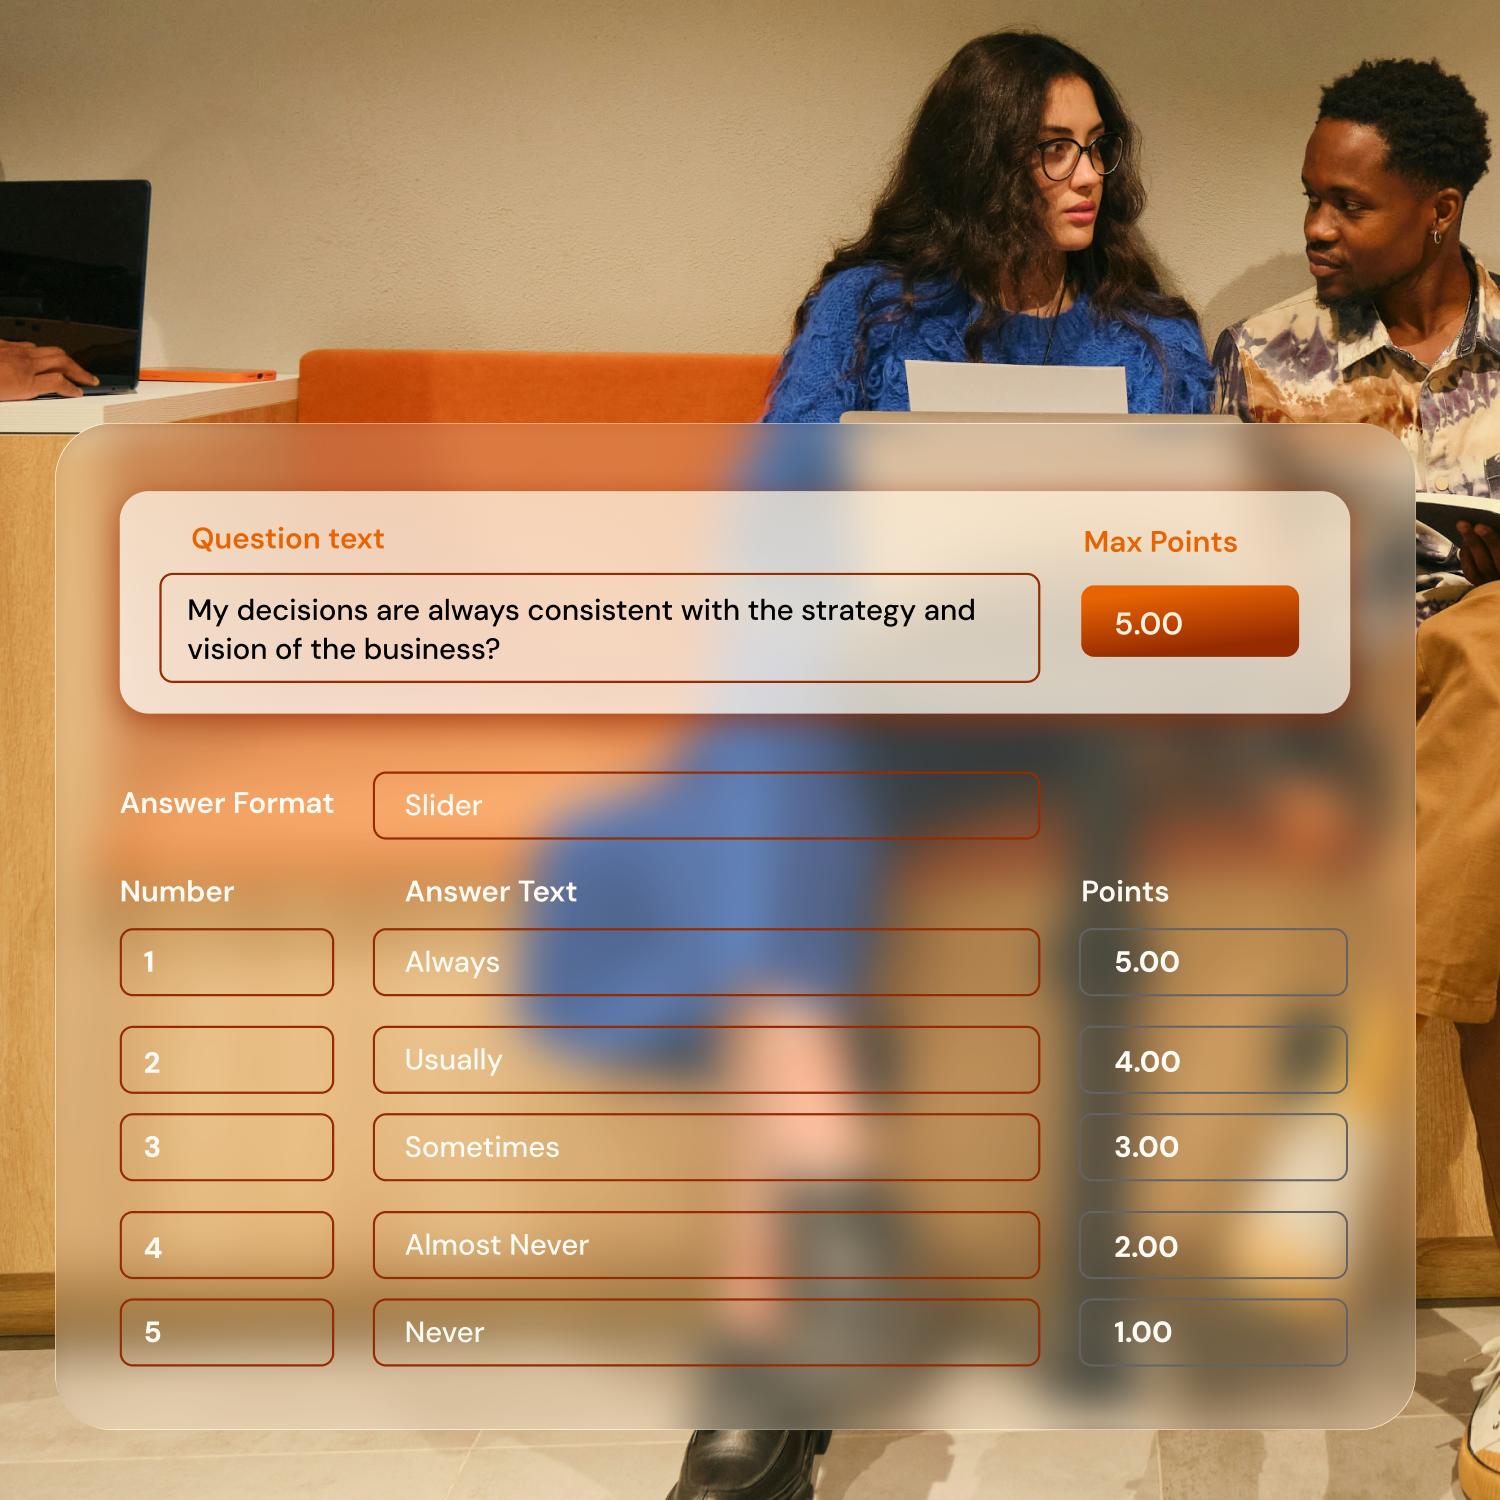
Automate Scoring
Create customizable scoring and rating bands to match your framework, without formulas.
Use AI Interpretations to generate scores for open text answers, uploads, and detailed answer combinations
Compare scores with peer averages, percentiles or predefined standards using benchmarks.

Deliver Polished Feedback
Deliver professional PDF reports with charts and feedback generated automatically.
Share a secure online results view that’s easy to explore and engage with.
Turn open text answers and uploads into drafted feedback with AI. Review and override AI-generated feedback before publishing anything to respondents as needed.
Repeat assessments to track progress, compare iterations, and show improvement.