
Benchmark Assessments
Set the standard with a benchmark assessment.
Measure performance against industry standards, peer groups, or targets in one place. Compare by averages, percentiles, or seeded values using unlimited classifiers for role, region, or program. Build benchmark-ready assessments faster with AI Suggest and explain comparisons clearly with AI Interpretation.

Benchmarks three ways

Average Benchmark
Calculate a benchmark based on the average of scores.

Percentile Benchmarks
Calculate any percentile value (eg, 50% is the Mean, 75% is the top quartile).

Seeded Benchmarks
Add predefined benchmarks to set expectations.

Charting your benchmarks
Any chart can show up to three benchmarks alongside the response in a feedback report or responses in a cohort report.

Analyse responses in a context
Benchmarks help assessors contextualize individual or group performance within a broader cohort. This is invaluable for any scenario where comparative analysis shapes decisions or next steps.
Using as many classifiers as you need to collect insight at a role, expertise, or any other level, identify trends and outliers at a glance your favorite chart type.

Give respondents more than a score
Assessments often leave respondents wondering how they measure up. Benchmarks show respondents how they compare, whether it's to an average, a percentile, or a predefined goal.
Using charts, respondents can see, for example, how they compare to team members in the same role or stack up against respondents in the same region.

Create shortlists for recruitment
If you have an assessment as part of your recruitment process, benchmarks can help filter applicants' skillsets against benchmarks and define whether they fulfill required attributes.
In Brilliant Assessments Advanced, integrate with your Applicant Tracking System to automate the respondent and cohort creation process, or feed outcomes back into your system.
Connect benchmarks across assessments.
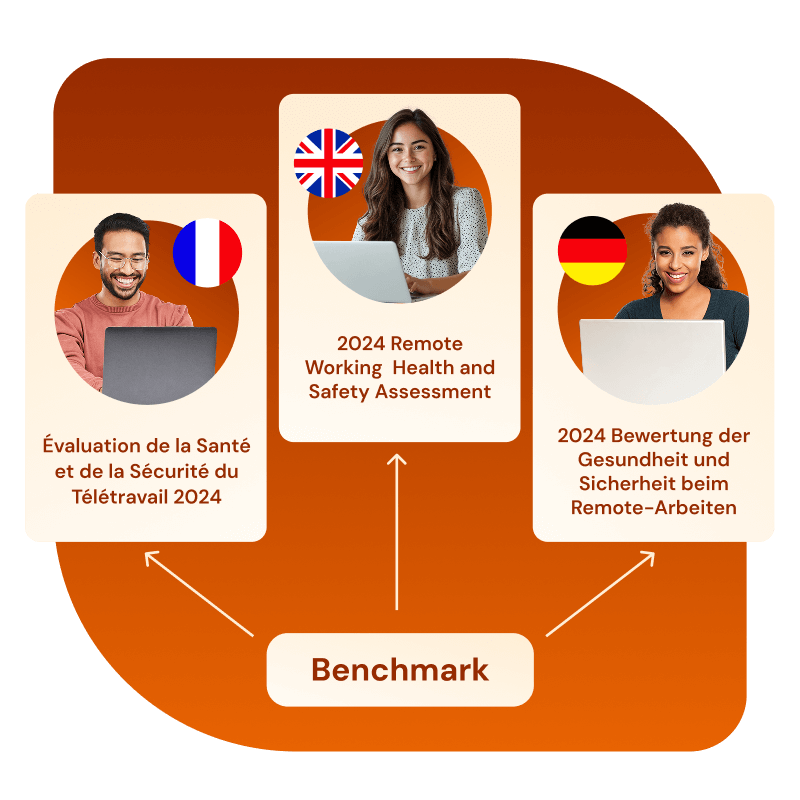
You can include multiple assessments in each benchmark, provided they are structured exactly the same. This is particularly helpful for multilingual assessments or copies created for different brands and organizations.