Group Assessments
Create an assessment for any group
In Brilliant Assessments, a ‘cohort’ is any group of responses. This might be a group of individuals, a group of 360 assessment participants, a team, an organization, or multiple organizations. If you can group it, you can make a cohort and create feedback at a collective level.
Create your cohort, your way
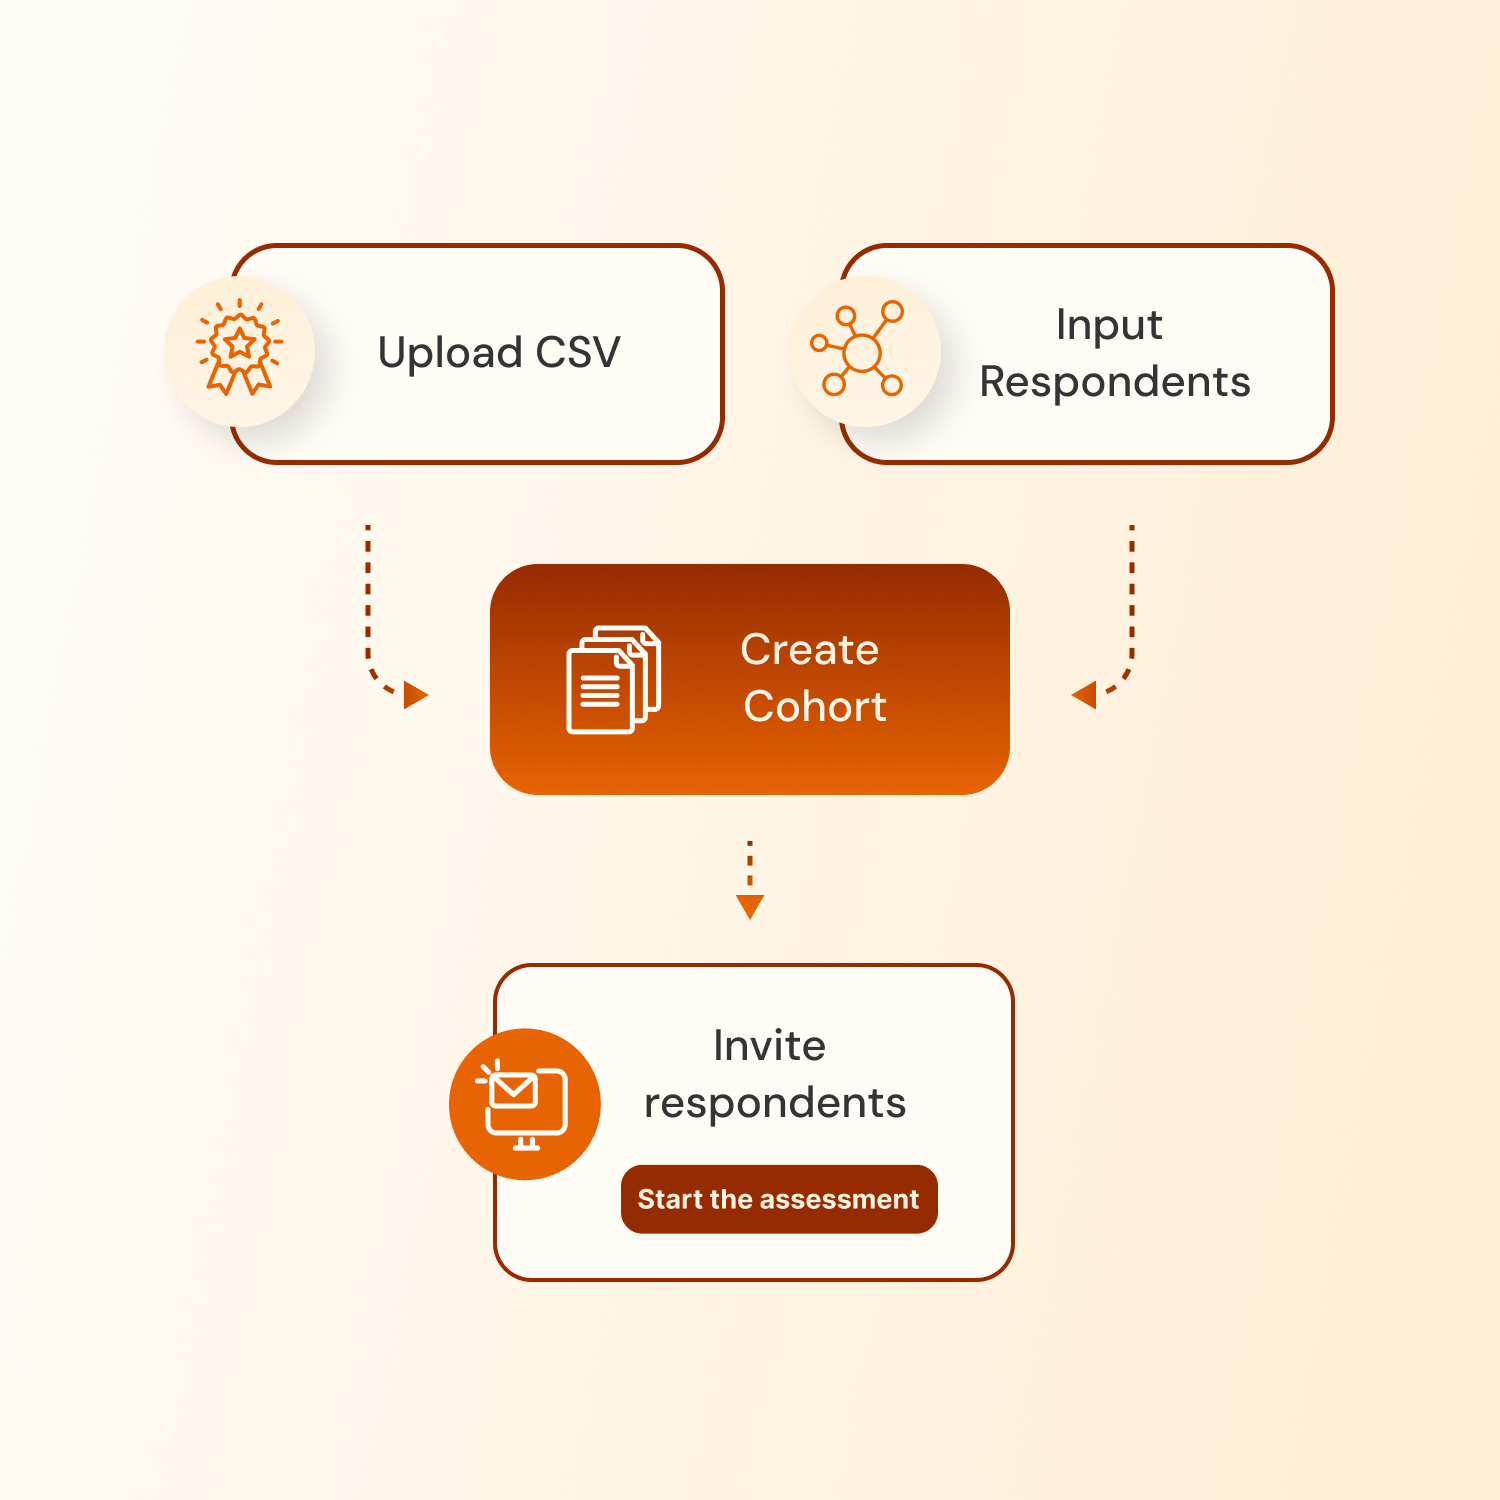
Administrator managed
Administrators can use CSV Upload or enter respondent details to create cohorts for subjects. Automated emails are sent to respondents, inviting them to complete the assessment.
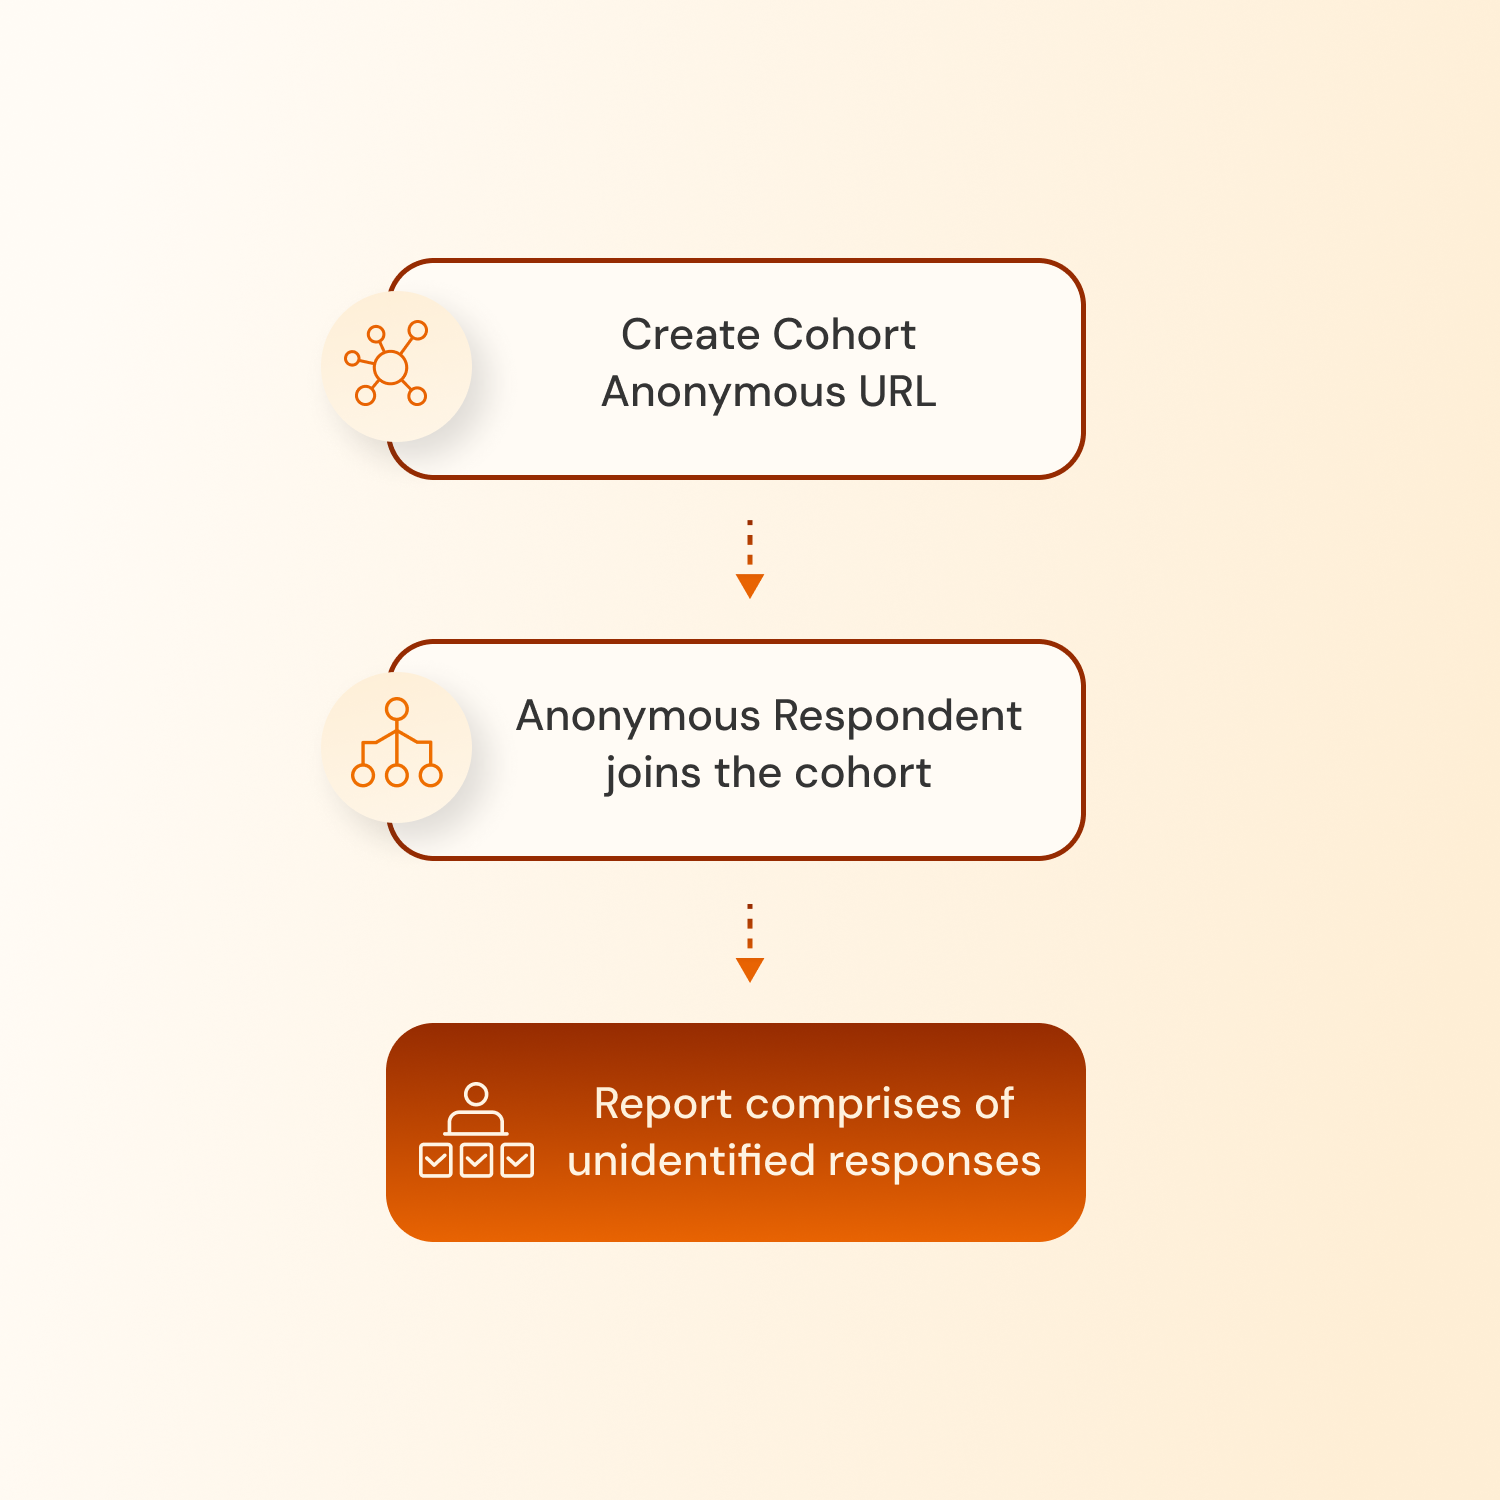
Anonymous
Want to maintain a level of privacy for respondents? Create a shareable cohort link for any cohort type, bypassing the need for direct invitations and supporting anonymous participation.
Externally initiated
Enable external cohort creation via URL. The cohort owner can follow the link to create the cohort and invite respondents. This option can include a credit card charge if desired.
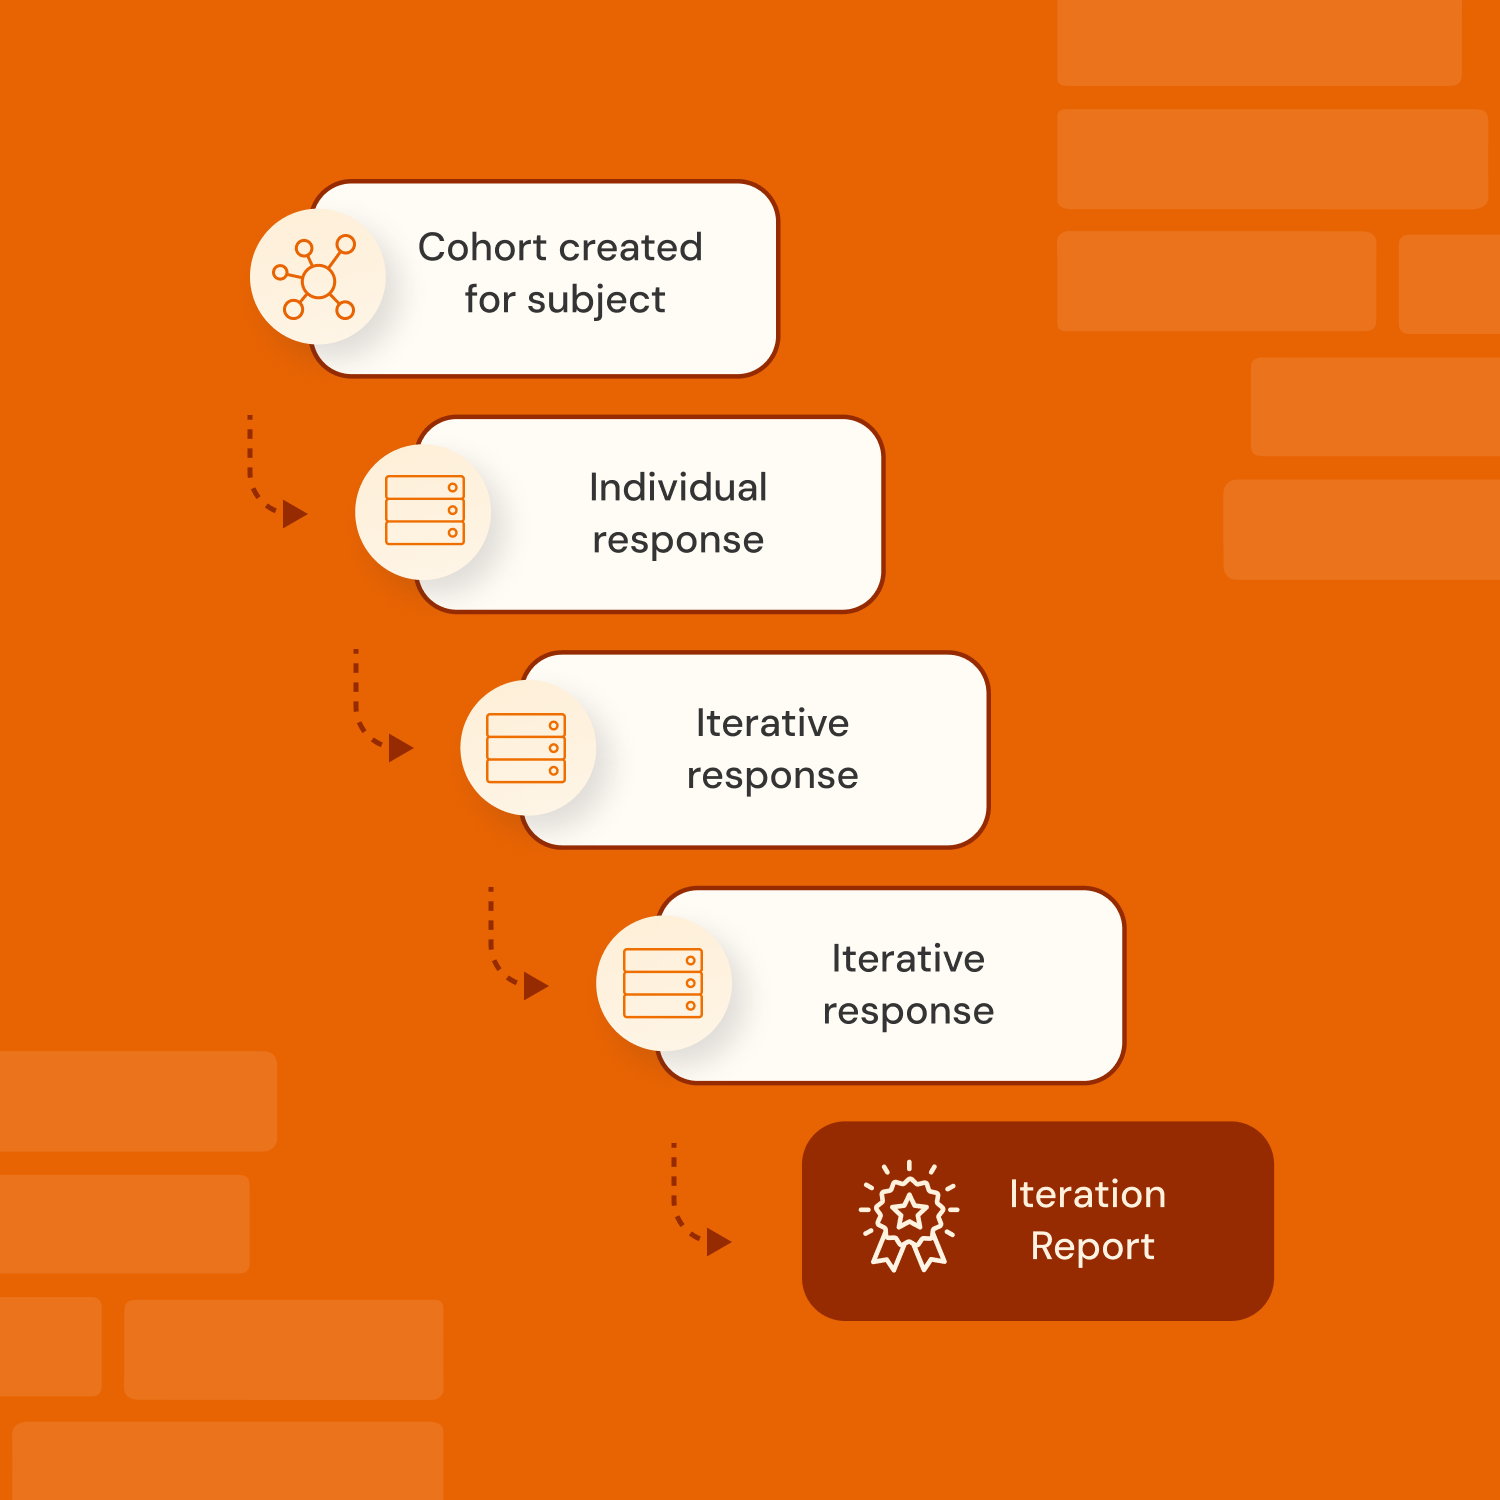
Automated individual cohorts
Enable ongoing cohort initiation for individual iterative results and feedback reports. The cohort collects individual responses matched with previous iterations by email.

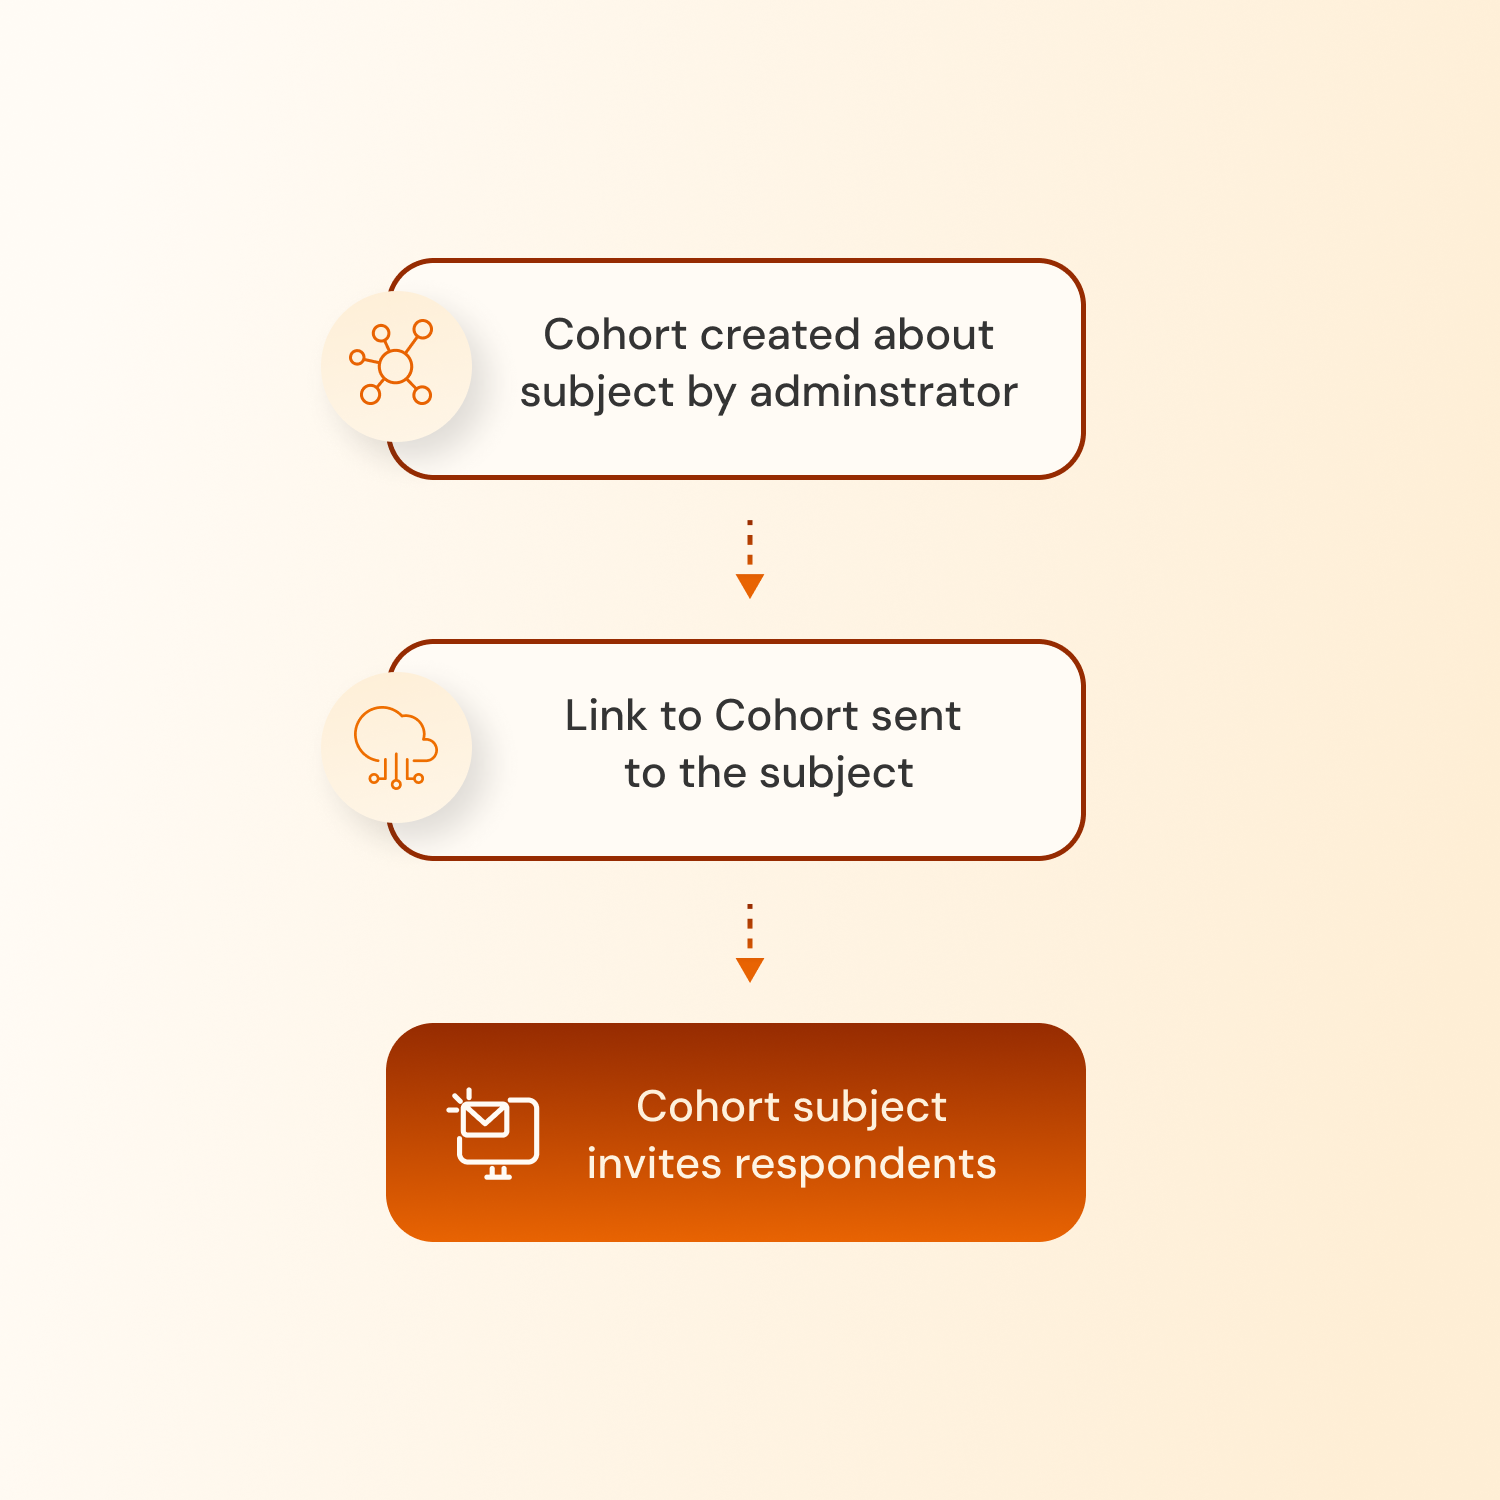
Outsourced
This is useful when subject details are available, but respondents are unknown. When an administrator creates a cohort the system sends an email with a link to the subject, who can then invite their respondents to participate.

Informal cohorts
Cohort Reports and Results can be produced for any grouping of responses you wish, for example, for everyone who has ever responded, date ranges, or by organization, classifier, or by selecting responses one by one.
Keep cohorts under control

Administration
Set the controls for timing and feedback
Brilliant Assessments gives administrators complete control over cohort timing and reporting, ensuring that assessments are delivered at the right time, with the right number of responses captured.

Dynamic cohorts
Update cohort lists easily
An individual response can be connected to any number of cohorts. Dynamic cohorts create a search and select function, which makes assigning participants simple and quick.
Make cohort feedback brilliantly personalized
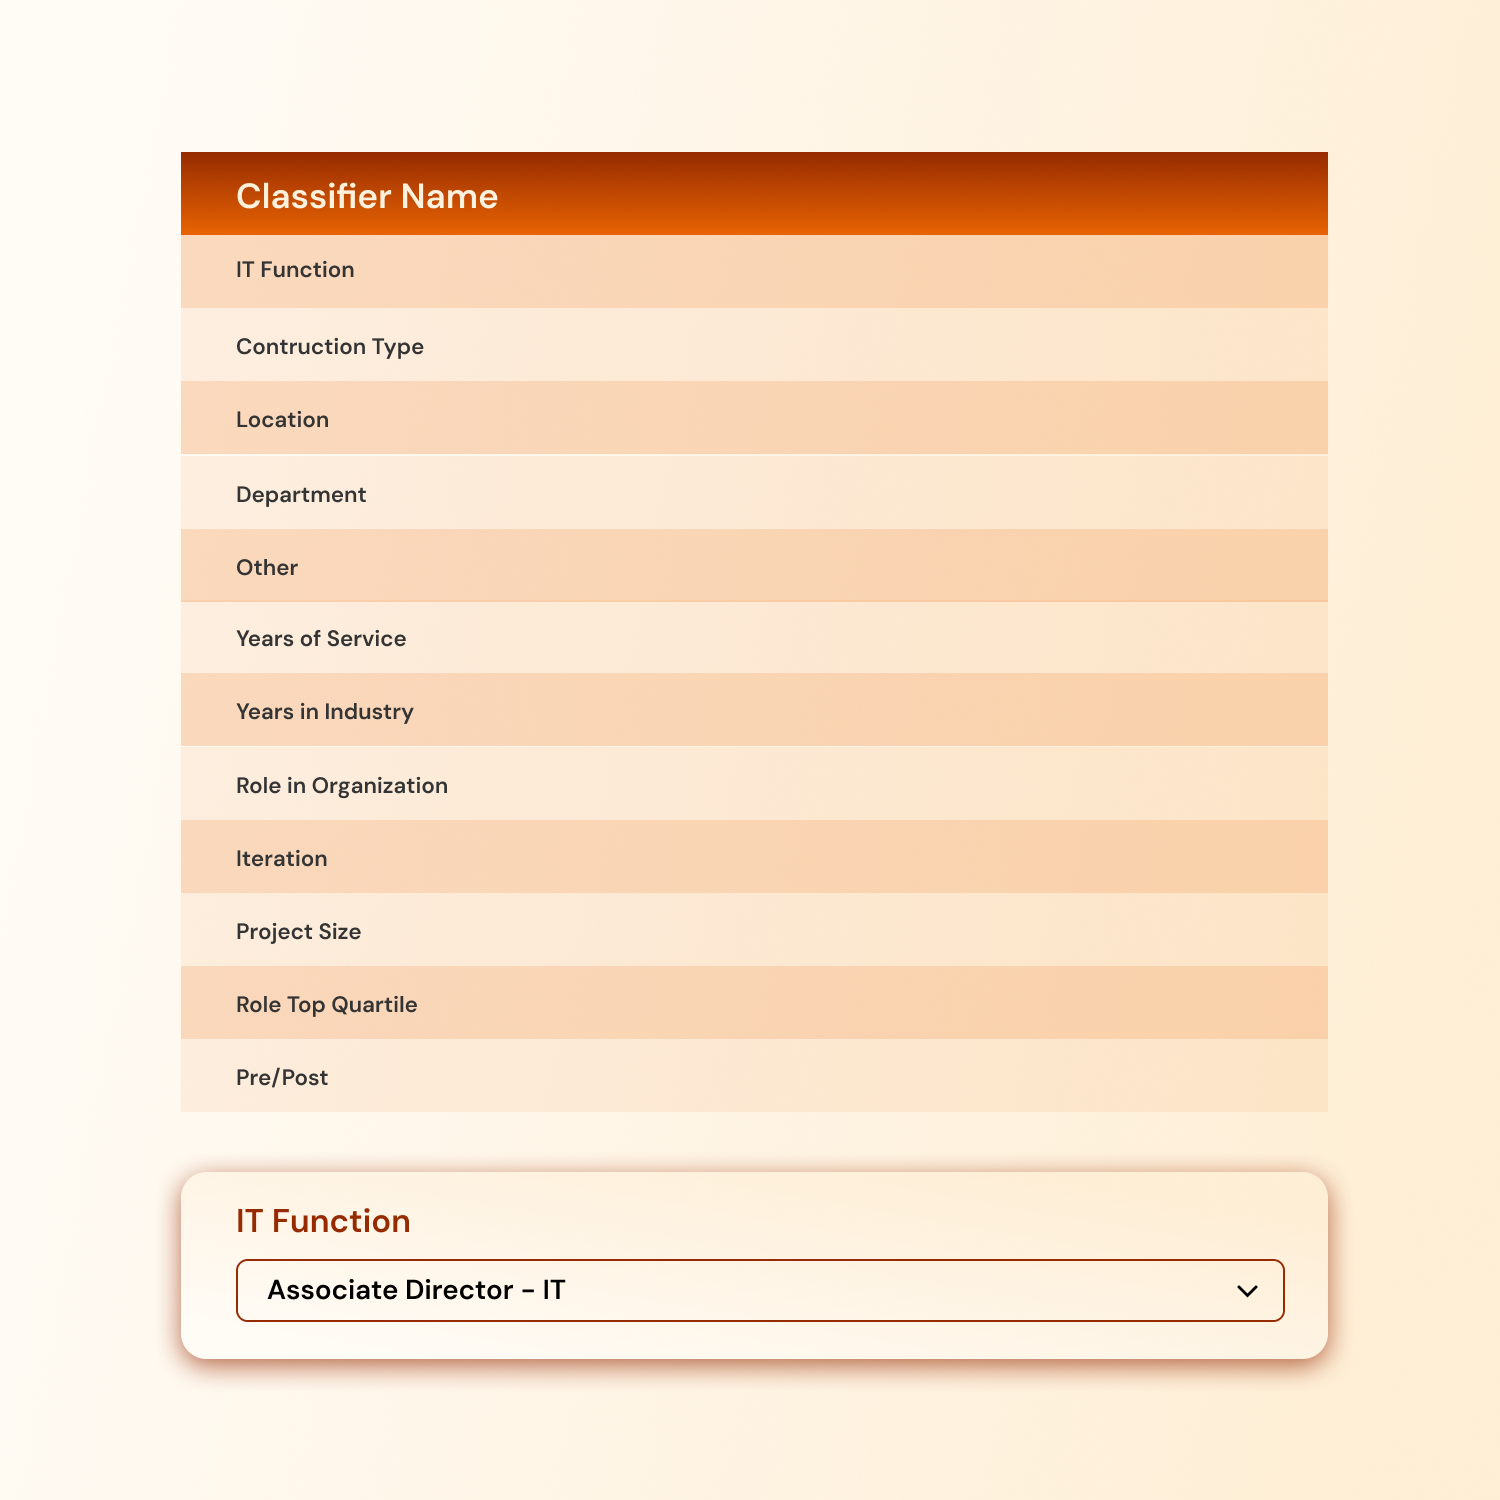
Classifiers
Slice and dice your cohort
Classifiers allow you to categorize responses within a cohort, making it easier to segment and analyze specific groups. Common classifiers include department, role, years of service, or seniority. In reports, you can cross-reference and compare different classifiers to identify patterns or inconsistencies.
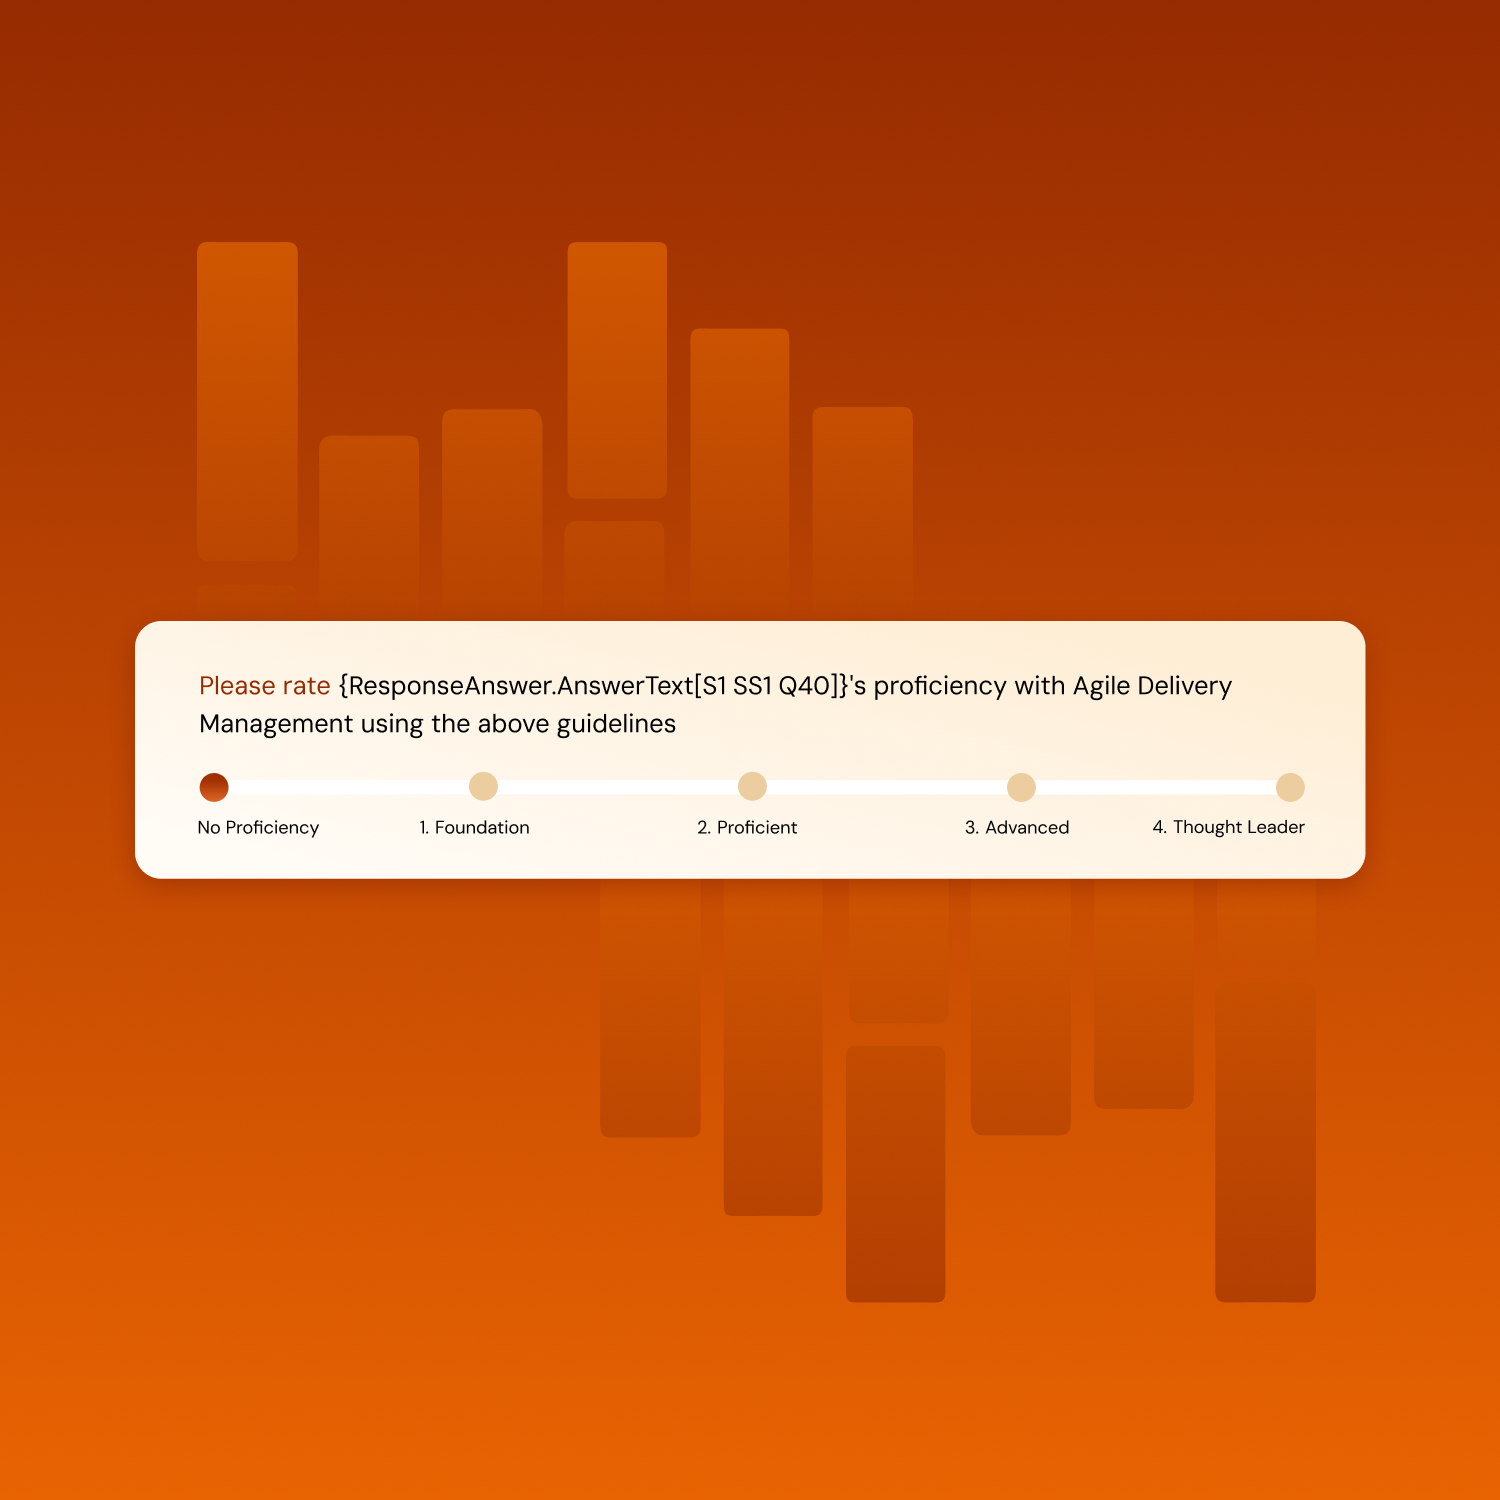
Piping
Frame questions with prior answers
Piping allows administrators to personalize the assessment experience by displaying previous responses within follow-up questions. This dynamically tailoring content based on individual responses.
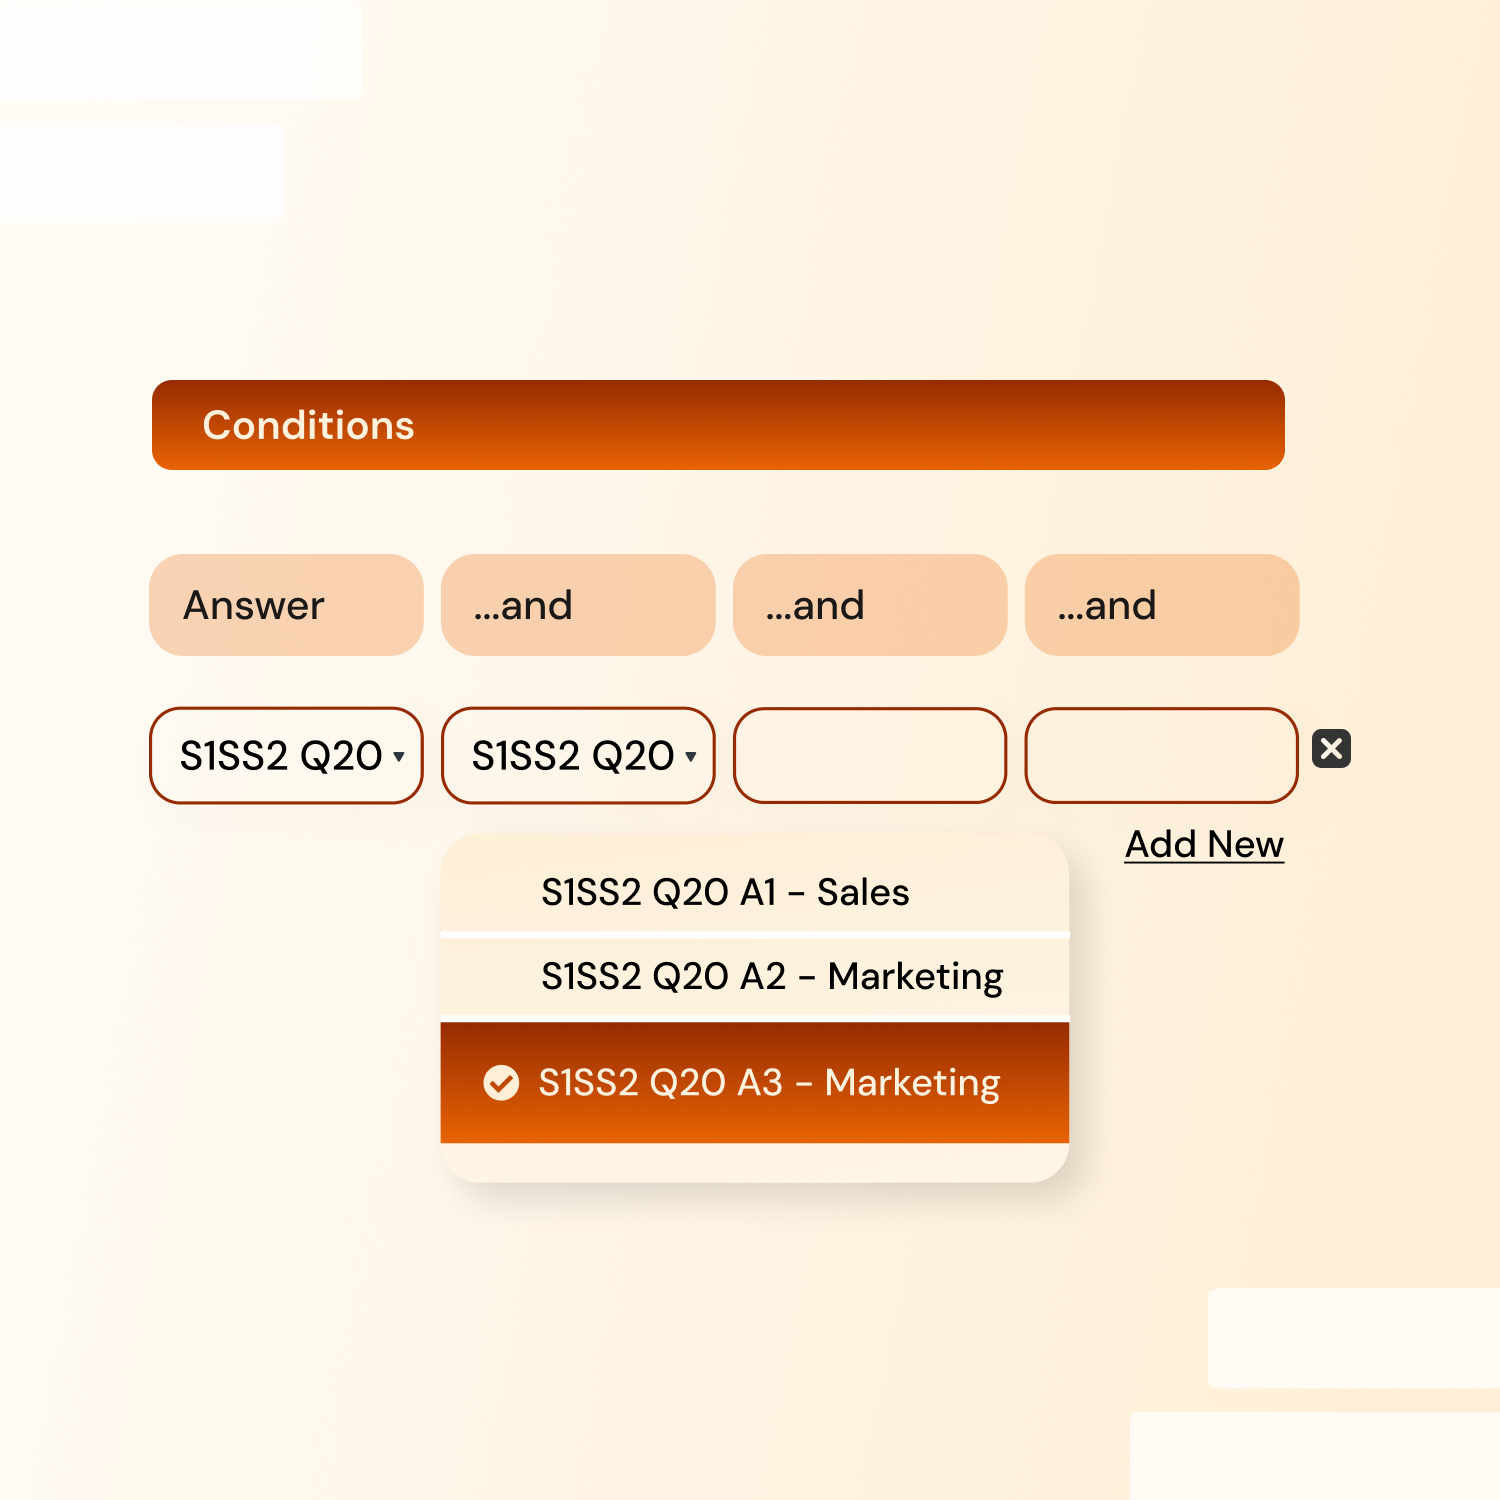
Conditional Questions
Carve the assessment paths
With conditions, administrators can control the flow of questions based on prior answers. This feature enables both “And” and “Or” logic, allowing custom paths to show only the most relevant questions to each respondent.
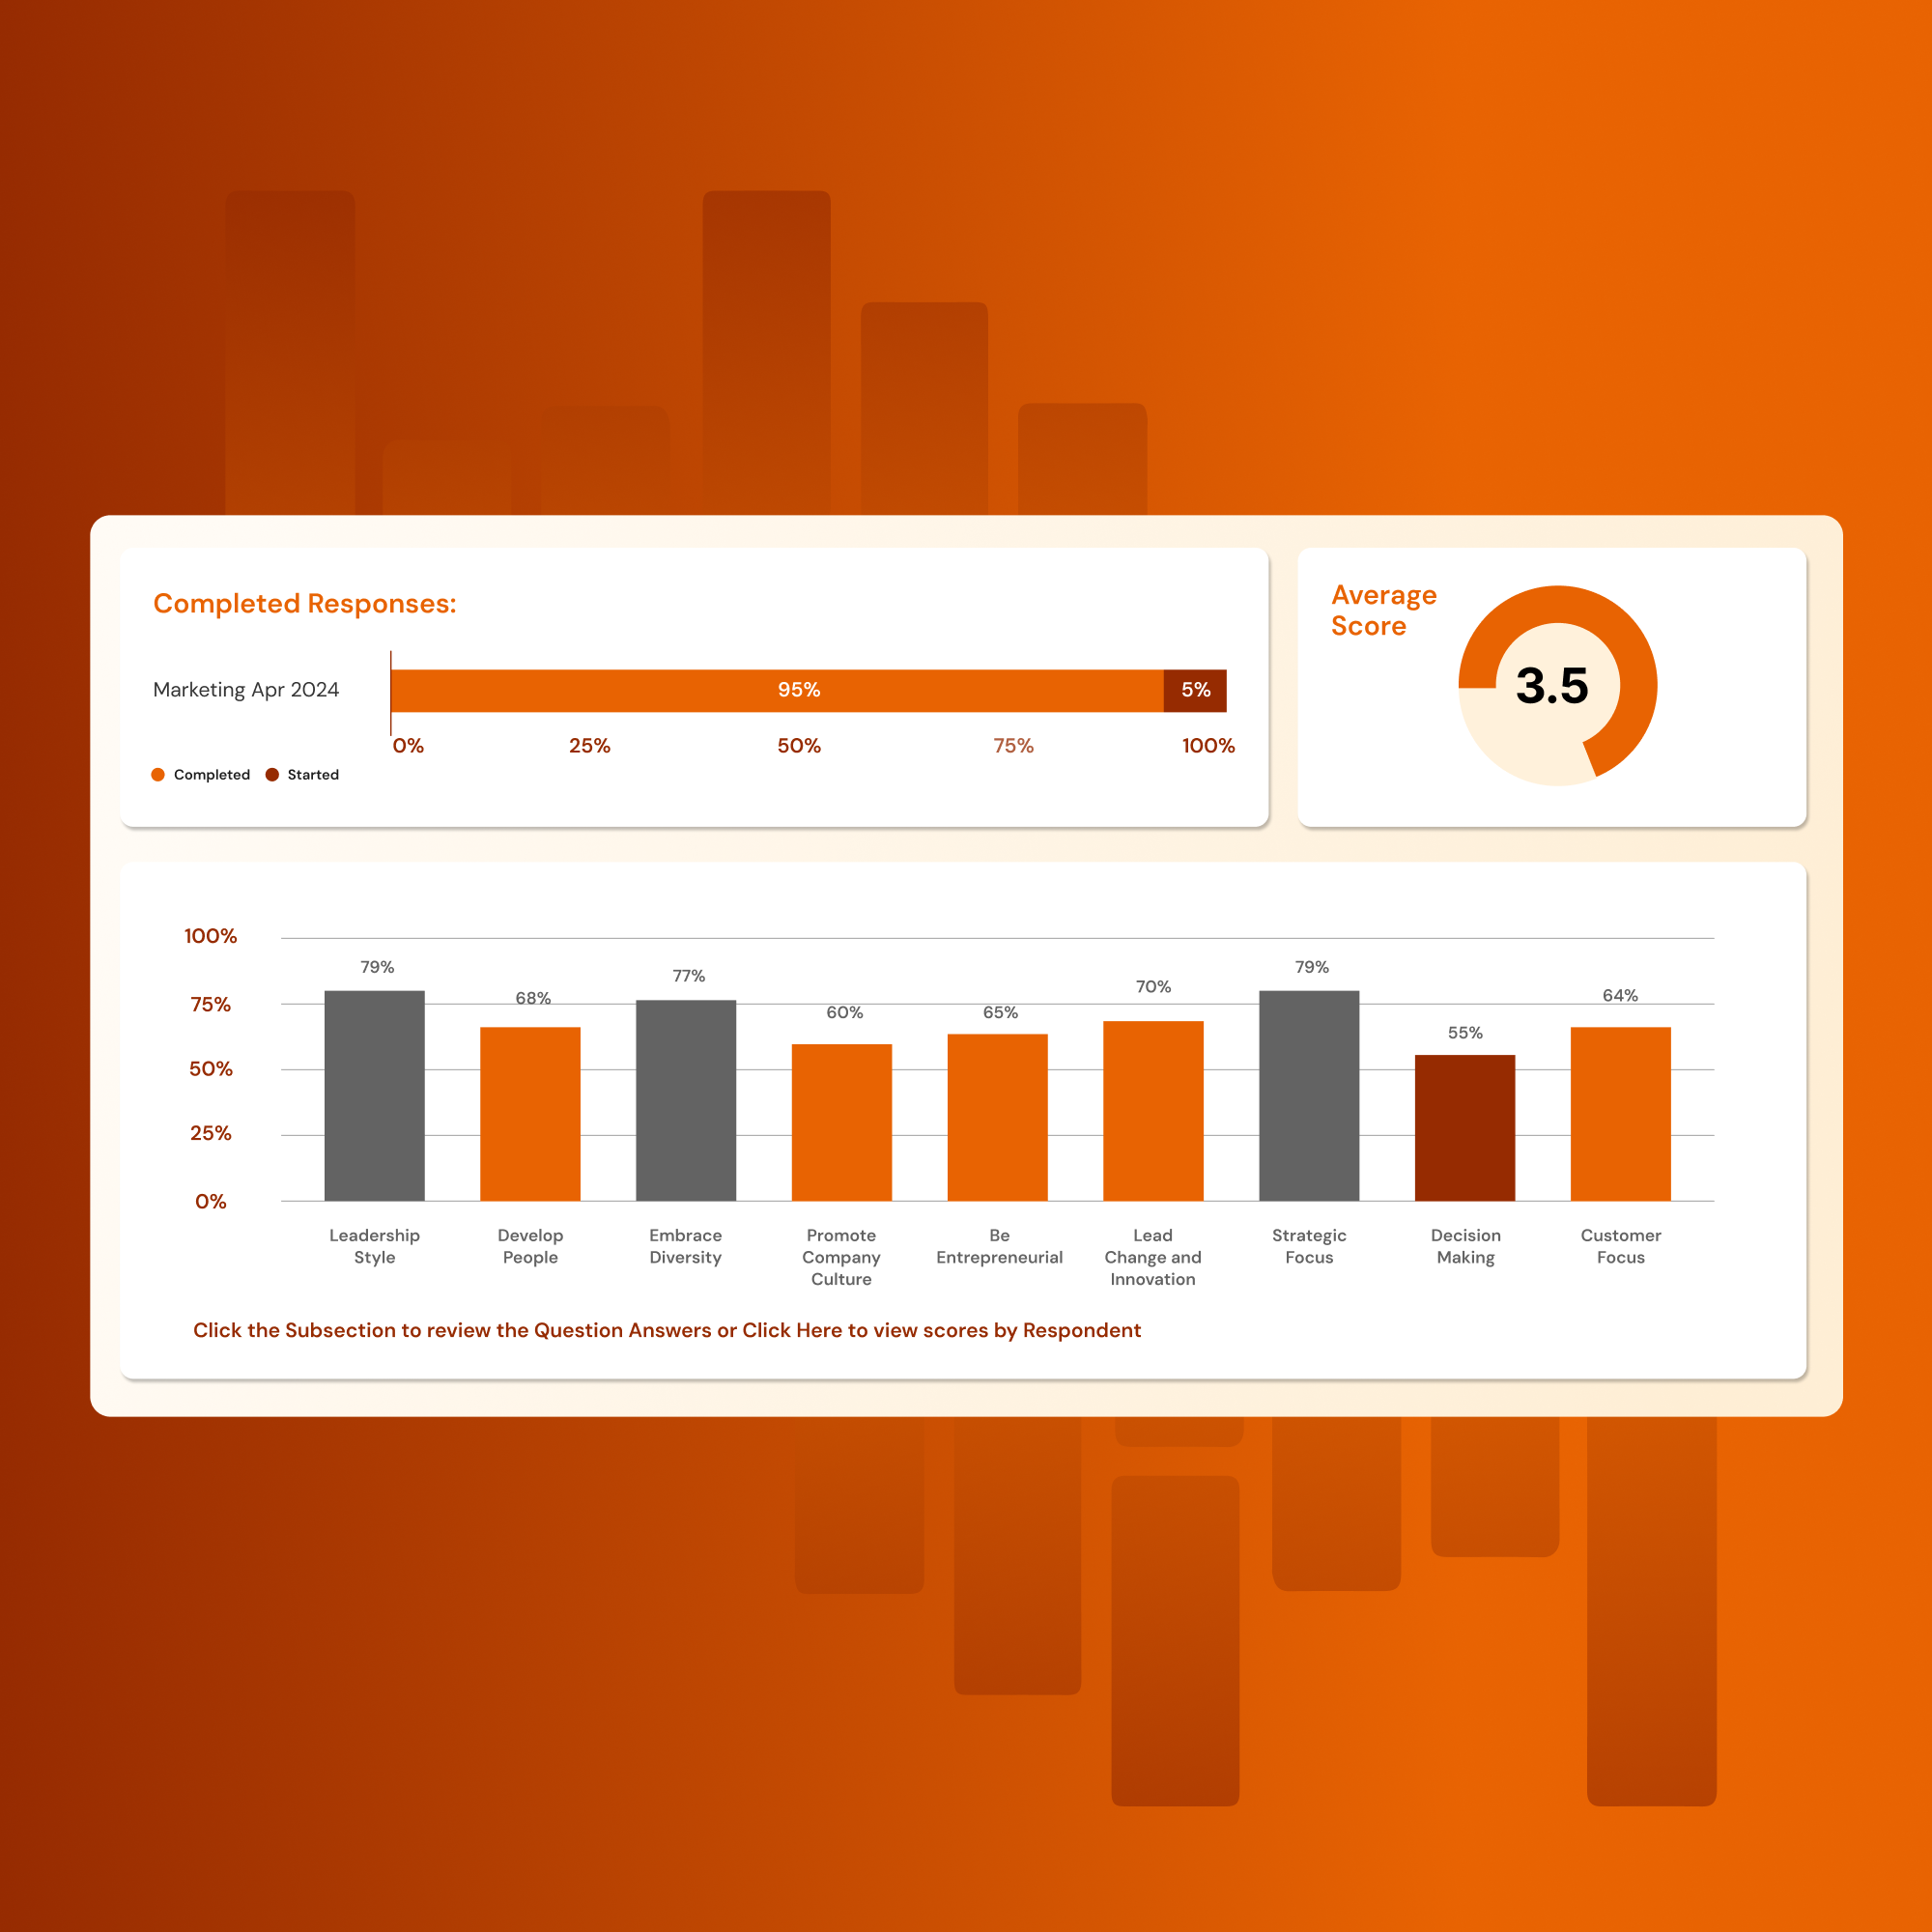
Reports when you’re ready
Brilliant Assessments provides three options for report and results generation.
Automated reports
If the respondent threshold is met, the cohort report and results link can be automatically generated and emailed upon reaching the completion date.
On-demand reports
Administrators can generate cohort reports manually whenever needed.
Results
Create a results page that updates as the cohort completes the assessment. Set this up so it isn’t available until the minimum threshold of responses is met and/or the completion date arrives.