Iterative Assessments

Assess progress and differences over time with iterations

“If you measure it, it will improve” - Seth Godin

Iterations provide dynamic insight into individual and group performance over time. Deliver feedback as a benchmark for improvement and change over time and offer valuable perspectives on growth, change, and effectiveness.

Bar chart comparing Jenny Horrell's scores to team averages across categories: Organization, Environmental, Project Management, External Risks. Jenny Horrell's scores are darker orange, team average scores are light cream.
Circular infographic showing average scores by areas assessed, before and after actions. Inner circle has categories like Leadership, Relationships, Trust, Empathy, and Culture & Values, with scores before and after. Outer circle indicates context, stakeholder engagement, team engagement, purpose and vision, strategic goals, and clarity, with scores before and after. The colors orange and brown represent after and before scores respectively.

Track change

Iterations are often used to track change and create a plan for continuous improvement. This might be an ongoing training program, a long-term project, or any scenario where measuring change and progress is valuable.

Capture growth

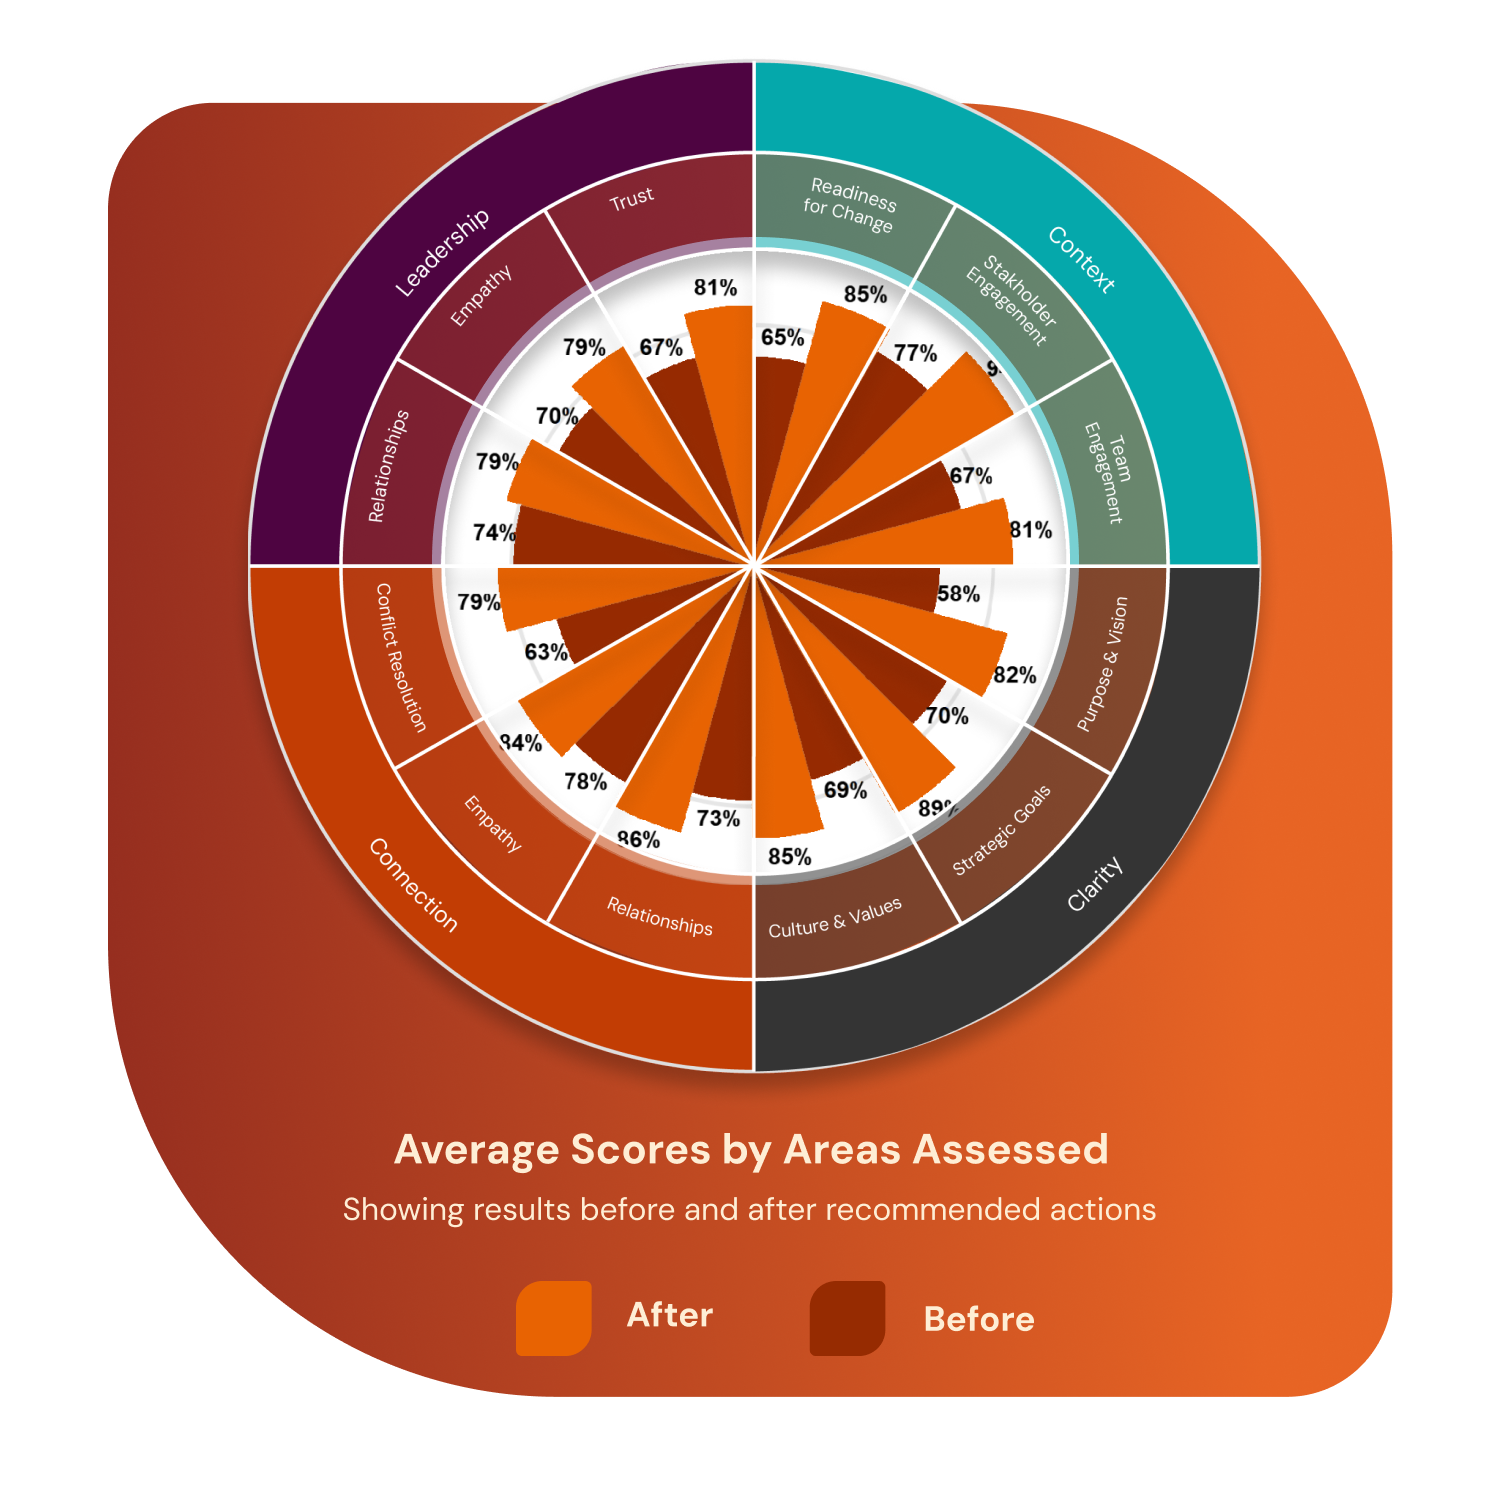
Iterations deliver a direct comparison of current performance against past assessments. Feedback reports show progress across different periods. This is particularly helpful for personal and business development plans.

A digital interface displaying an 'Iterations' form with fields for cohort iteration type name, label, number, original iteration, and next iteration generation date, over a blurred background of a calendar and a person writing.

Automate iterations

Automate interactions to start at specified intervals or create based on email address reuse.

A feedback report page with bar graphs showing results over time for categories like Overall, Leadership, Innovation, Strategic Focus, Ability to Execute, and Customer Focus, with data from July 2020 to July 2022.

Integrate with feedback

Bring iterations into your feedback reports and results pages to show progress and differences over time.

A smiling middle-aged man with gray hair and beard, wearing glasses and a suit, looking at a tablet, with a chart showing a 68% percentage increase since 2022 overlayed on the image.

Differences

Easily add positive or negative differences between iterations and to your feedback reports and charts.