

Assess any individual and turn results into clear next steps
Create self-assessments, assessor-led reviews, evidence-based submissions and reassessments over time, then deliver personalised feedback via polished reports and interactive results.
"We immediately fell in love with the platform. We now have our own coaching platform that completely differentiates us from the competition."
Tim Hagen, Leader at Progress Coaching
"Our auditors automatically receive the reports so that they can review them. This has allowed us to scale, grow, and utilize the automation within the tool. It also frees up our auditors' time to focus more closely on the assessments."
Rob Van Buskirk, Co-founder at VanRein Compliance
"We looked into a number of different solutions and we found that they were often too rigid for our needs, overly complicated to set up and manage, and outside of our budget. Brilliant Assessments delivered everything we needed.
Debbie Ogier, Administrator for Best Bar None by Six Till Six
Features you’ll love
Build fast
Get a strong first draft in minutes, then keep, edit, or regenerate as needed.
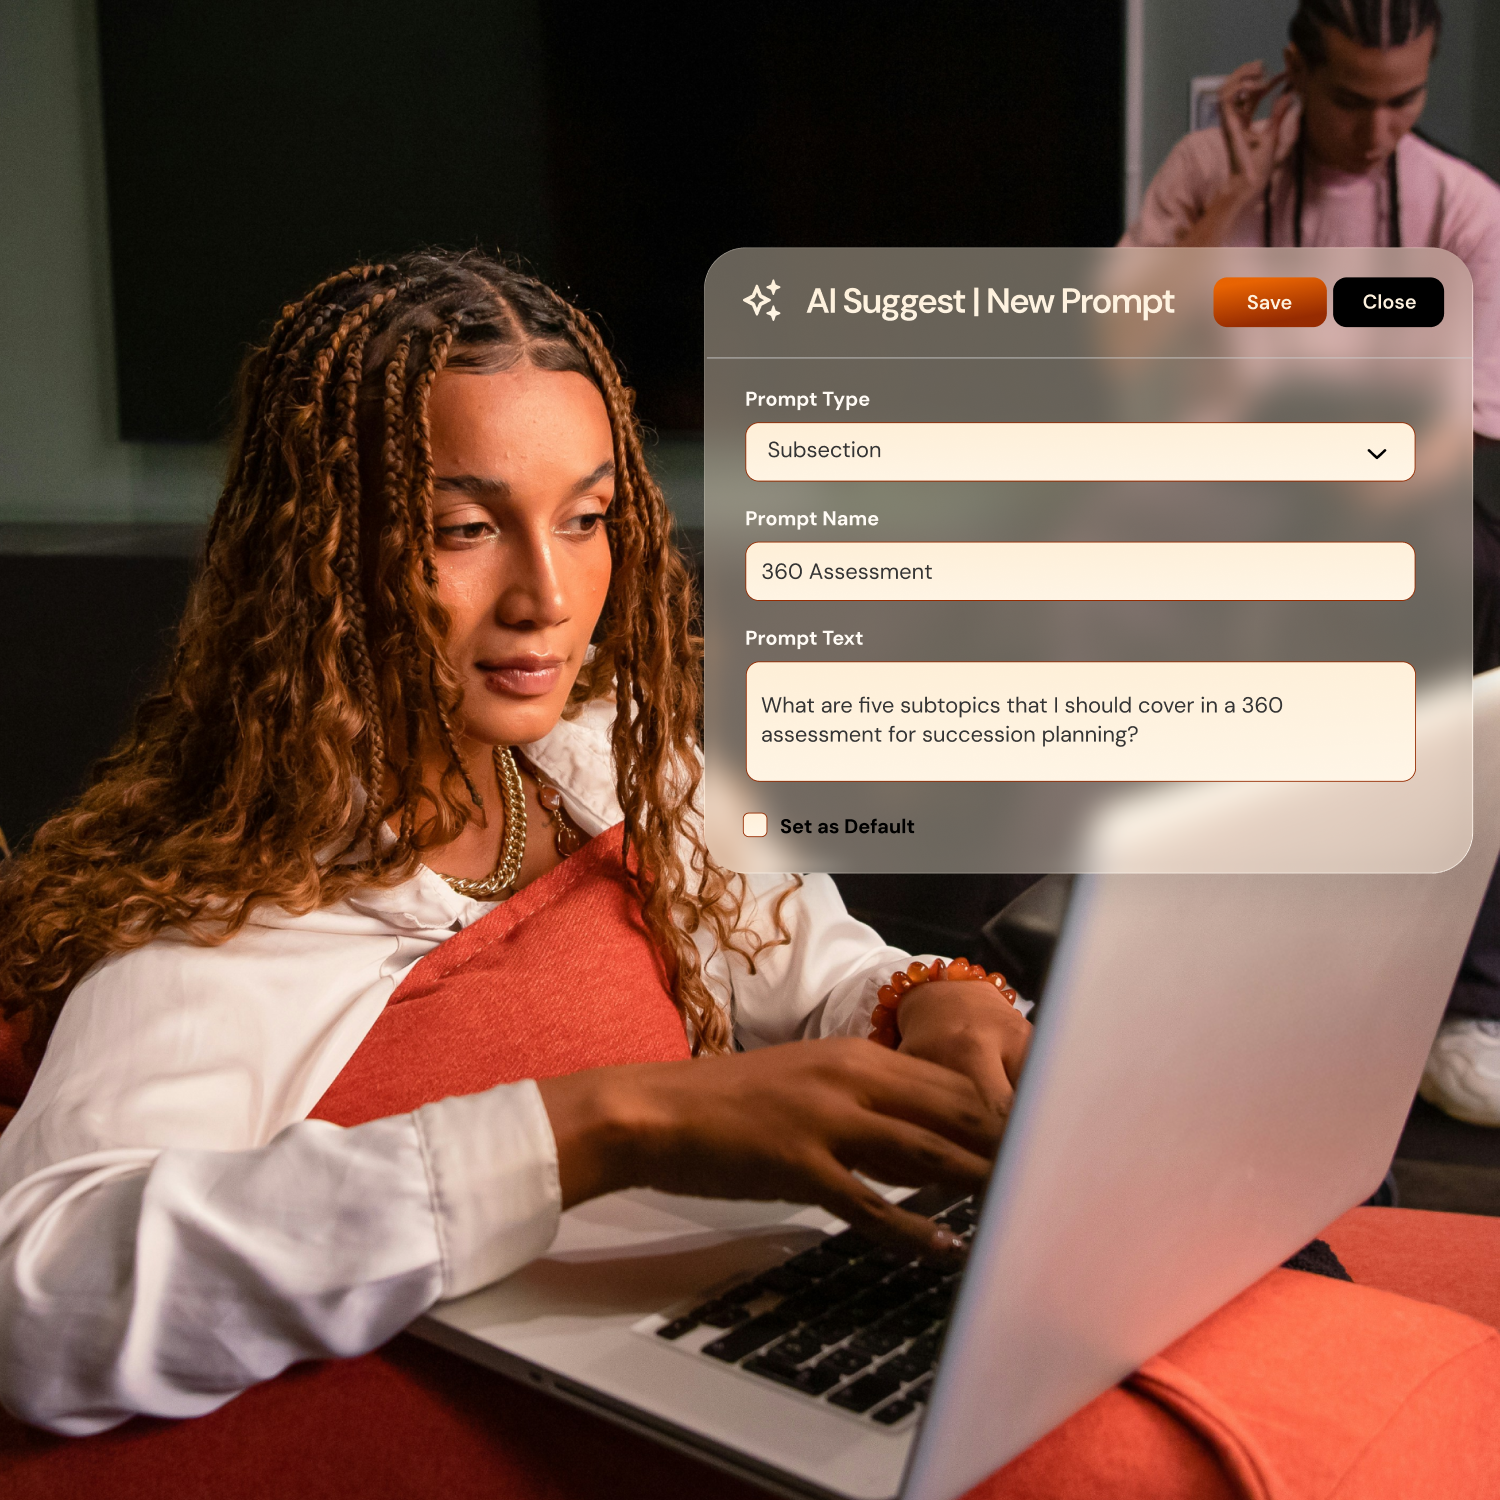
Use AI Suggest to build out sections, subsections, questions and write your report text.
Match the assessment experience to your brand with logos, colours, and messaging.
Base follow‑up questions on previous answers with conditional logic.
Automate Scoring
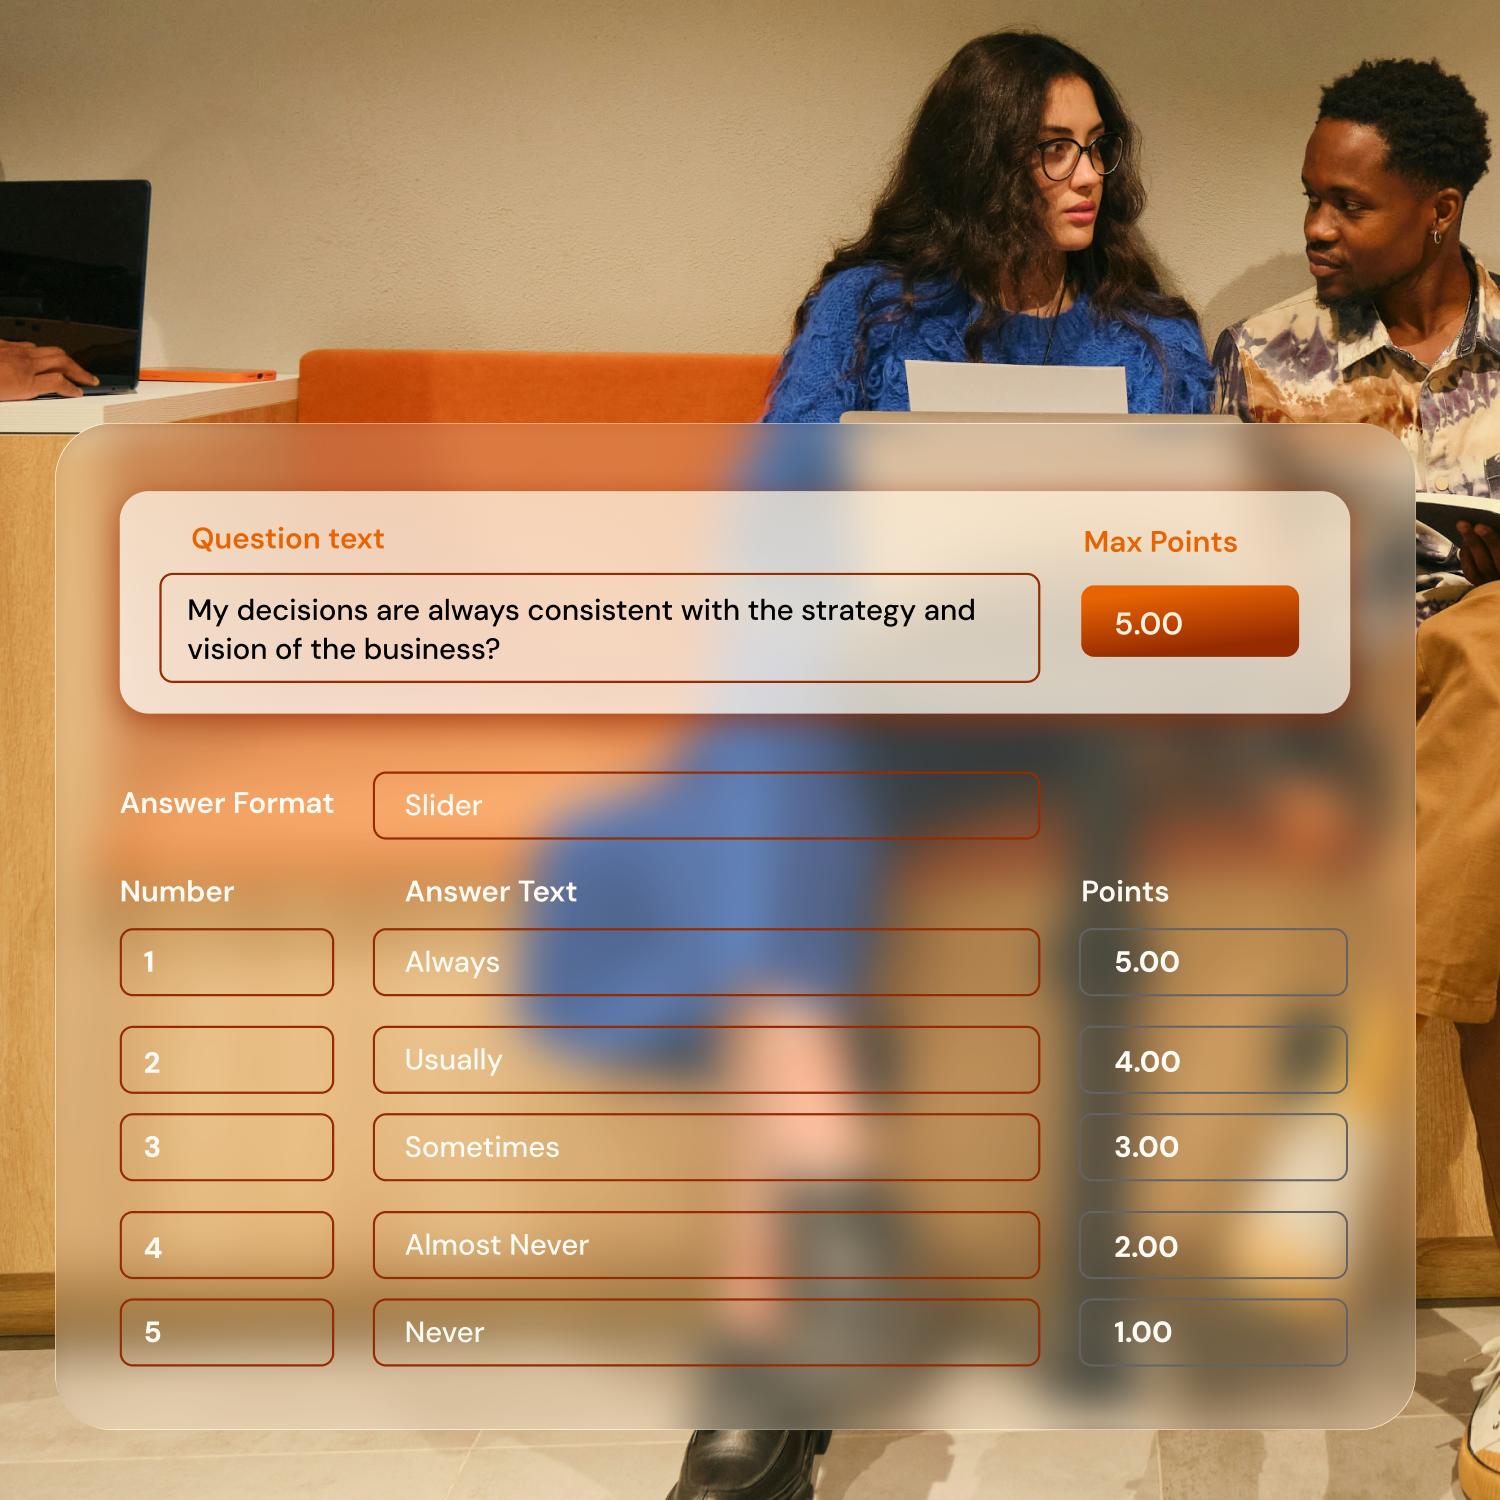
Create customizable scoring and rating bands to match your framework, without formulas.
Use AI Interpretations to generate scores for open text answers, uploads, and detailed answer combinations
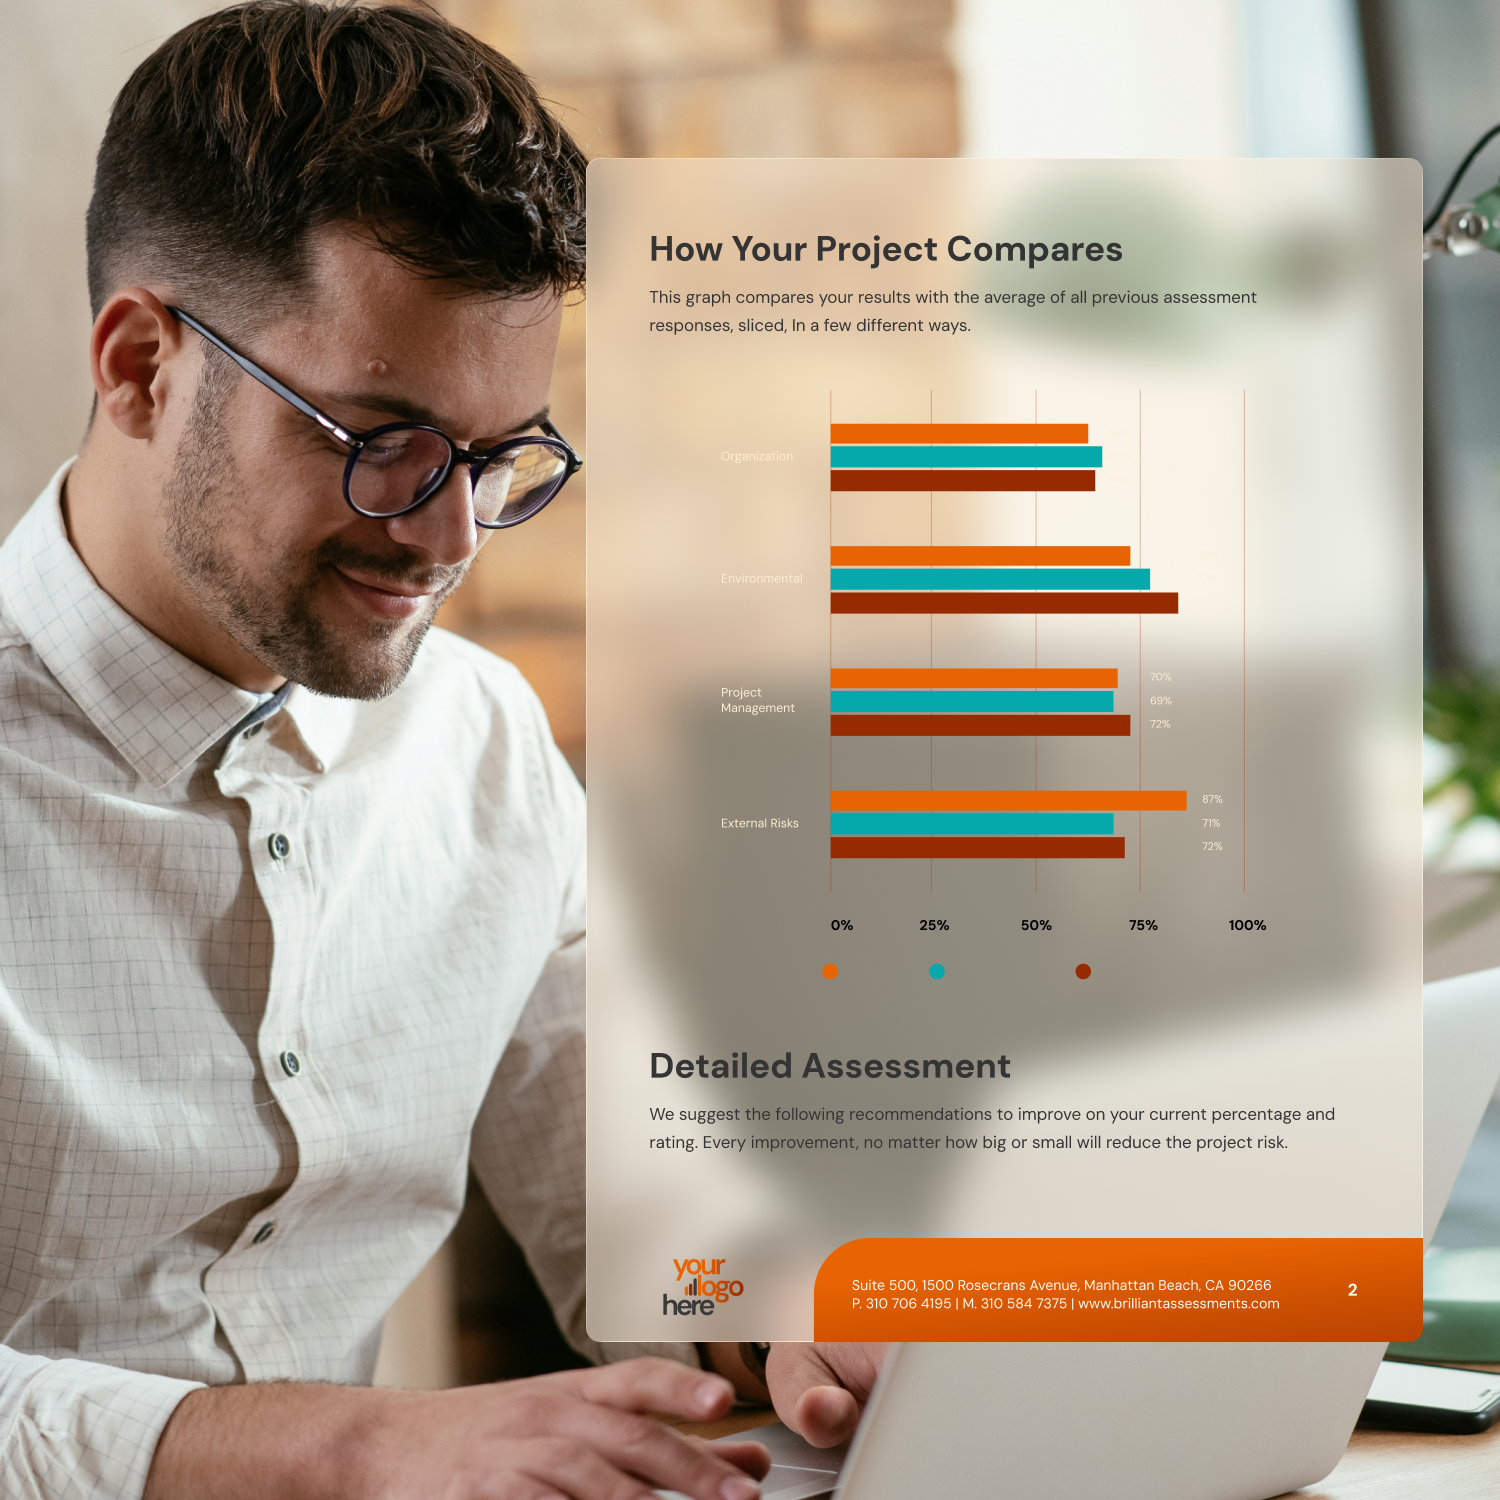
Compare scores with peer averages, percentiles or predefined standards using benchmarks.
Deliver Polished Feedback
Deliver professional PDF reports with charts and feedback generated automatically.
Share a secure online results view that’s easy to explore and engage with.
Turn open text answers and uploads into drafted feedback with AI. Review and override AI-generated feedback before publishing anything to respondents as needed.
Repeat assessments to track progress, compare iterations, and show improvement.