
Tips to help you make the most of your Brilliant Assessments trial
For writers, the blank page feels daunting, but for assessment builders, it’s the first question.
Your trial period is the perfect opportunity to explore the full potential of Brilliant Assessments. Here are some tips to help you make the most of it and determine whether it’s the best platform for you.

Build your Welcome Section
The welcome section sets the scene for your assessment and allows you to gather respondent details. To make it as useful as possible, try to:
Collect Key Information
Decide what participant details, such as names, email addresses, or business information, you want to capture. The system automatically records this information by mapping these fields to the response settings, saving you from manual data entry.Use Classifiers to Segment Responses
Incorporate classification questions to categorize responses based on industry, company size, or experience level. This helps you to deliver more meaningful comparisons and benchmarking.
Create Some Questions and Answers
Consider the best answer formats for your needs:
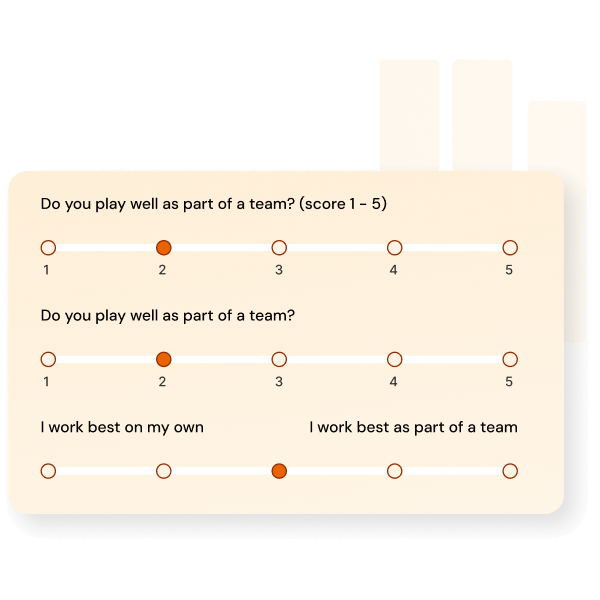
Sliding Scales – Measure intensity, satisfaction, or agreement on a continuum.
Column Formats – Allow structured side-by-side comparisons.
Single-Choice & Multi-Choice – Offer straightforward selection options.
Open Text Fields – Provide room for personalized insights and detailed feedback.
Be aware of being too leading with your questions. An excellent assessment doesn’t coax respondents in a particular direction.

Check out the Assessment Settings
Make your assessment yours, by customizing settings that impact both branding and functionality. In the Assessment Settings section, you can:
Customize Design & Branding – Ensure your assessment aligns with your organization’s style and identity.
Set Up Automated Email Templates – Streamline communication with participants by preconfiguring welcome emails, reminders, and follow-ups.
Add Feedback Reports – Create clear, well-organized reports that provide value to participants and stakeholders.

Try a Results Page to Test Charting
Visualizing assessment results effectively can make an assessment feel ‘real.’ Test different charting options within a Results Page during your trial to see how your data is presented using a test response.
Explore Different Chart Types
Try bar graphs, spider charts, and other visual formats to see what best represents your data.Check Response Groupings
Make sure that responses are categorized correctly based on your assessment structure.Experiment with Benchmarks
Compare individual responses against averages or industry standards for added context.
Happy building! To start a trial, click here.