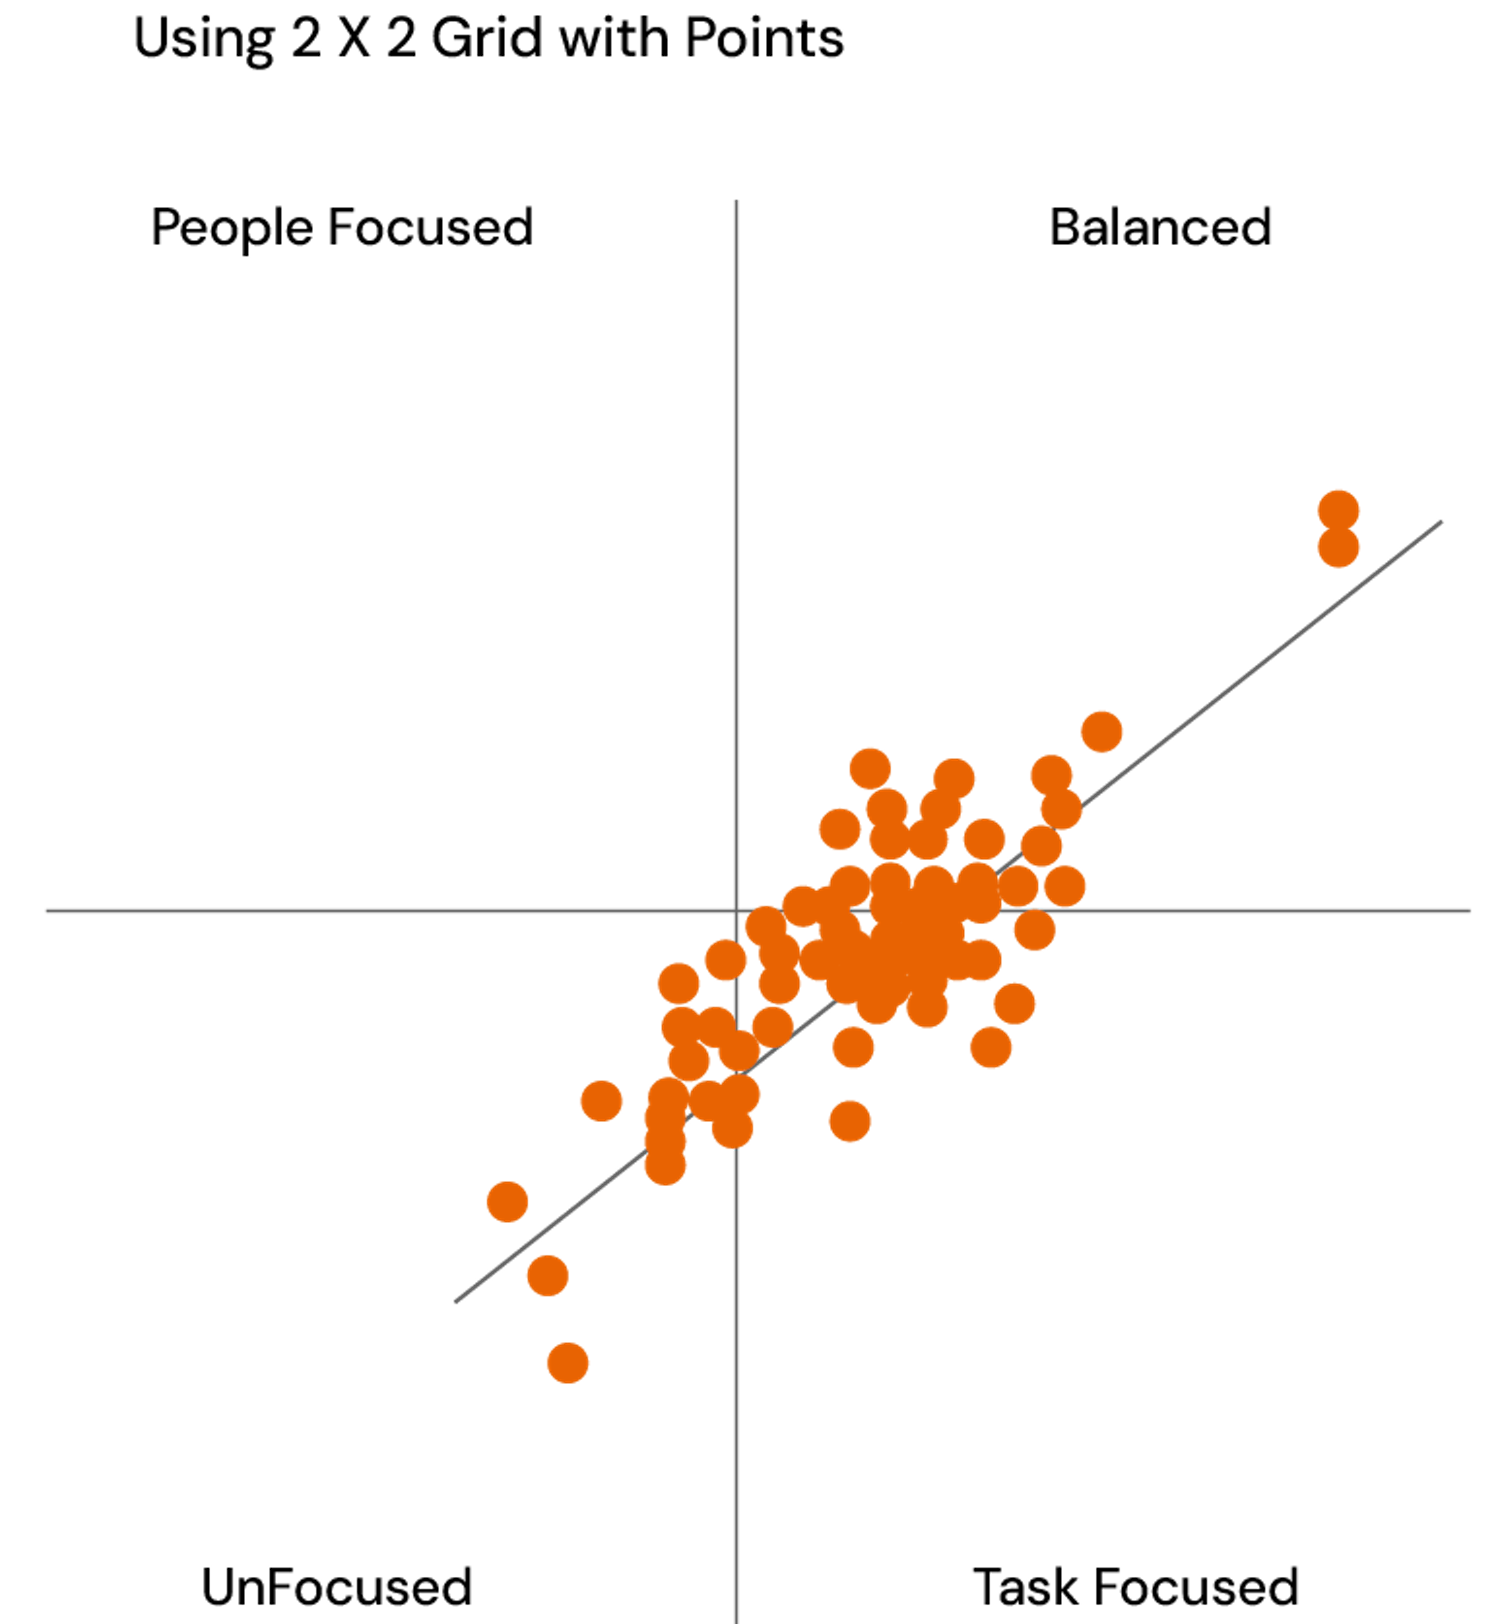
Scatter charts
Scatter plot charts often display the relationship between two numerical variables. It consists of individual points plotted on a two-dimensional graph, each representing an observation from the response/s. The position of each point is determined by the values of the two variables being compared, with one variable represented on the x-axis (horizontal) and the other on the y-axis (vertical).